Supported by Dr. Osamu Ogasawara and  . . |
|
Last data update: 2014.03.03 |
massi_dipDescriptionThe massi_dip function applies the dip test to the subset of y chromosome probe values returned from the Usagemassi_dip(y_subset_values) Arguments
DetailsThis function caclulates z-scores for the y.chromosome probe values returned from the ValueThis function returns a list containing
Author(s)Sam Buckberry ReferencesMartin Maechler (2013). diptest: Hartigan's dip test statistic for unimodality - corrected code. R package version 0.75-5. http://CRAN.R-project.org/package=diptest See Also
Examples# load the test dataset data(massi.test.dataset, massi.test.probes) massi_select_out <- massi_select(expression_data=massi.test.dataset, y_probes=massi.test.probes, threshold=4) # Use the list returned from massi.select to calculate dip statistics and z-scores. massi_dip_out <- massi_dip(y_subset_values=massi_select_out) # view a density plot plot(massi_dip_out[[3]]) # view a histogram of z-scores hist(x=massi_dip_out[[2]]) Results
R version 3.3.1 (2016-06-21) -- "Bug in Your Hair"
Copyright (C) 2016 The R Foundation for Statistical Computing
Platform: x86_64-pc-linux-gnu (64-bit)
R is free software and comes with ABSOLUTELY NO WARRANTY.
You are welcome to redistribute it under certain conditions.
Type 'license()' or 'licence()' for distribution details.
R is a collaborative project with many contributors.
Type 'contributors()' for more information and
'citation()' on how to cite R or R packages in publications.
Type 'demo()' for some demos, 'help()' for on-line help, or
'help.start()' for an HTML browser interface to help.
Type 'q()' to quit R.
> library(massiR)
Loading required package: cluster
Loading required package: gplots
Attaching package: 'gplots'
The following object is masked from 'package:stats':
lowess
Loading required package: diptest
Loading required package: Biobase
Loading required package: BiocGenerics
Loading required package: parallel
Attaching package: 'BiocGenerics'
The following objects are masked from 'package:parallel':
clusterApply, clusterApplyLB, clusterCall, clusterEvalQ,
clusterExport, clusterMap, parApply, parCapply, parLapply,
parLapplyLB, parRapply, parSapply, parSapplyLB
The following objects are masked from 'package:stats':
IQR, mad, xtabs
The following objects are masked from 'package:base':
Filter, Find, Map, Position, Reduce, anyDuplicated, append,
as.data.frame, cbind, colnames, do.call, duplicated, eval, evalq,
get, grep, grepl, intersect, is.unsorted, lapply, lengths, mapply,
match, mget, order, paste, pmax, pmax.int, pmin, pmin.int, rank,
rbind, rownames, sapply, setdiff, sort, table, tapply, union,
unique, unsplit
Welcome to Bioconductor
Vignettes contain introductory material; view with
'browseVignettes()'. To cite Bioconductor, see
'citation("Biobase")', and for packages 'citation("pkgname")'.
> png(filename="/home/ddbj/snapshot/RGM3/R_BC/result/massiR/massi_dip.Rd_%03d_medium.png", width=480, height=480)
> ### Name: massi_dip
> ### Title: massi_dip
> ### Aliases: massi_dip
>
> ### ** Examples
>
>
> # load the test dataset
> data(massi.test.dataset, massi.test.probes)
>
> massi_select_out <- massi_select(expression_data=massi.test.dataset, y_probes=massi.test.probes, threshold=4)
>
> # Use the list returned from massi.select to calculate dip statistics and z-scores.
> massi_dip_out <- massi_dip(y_subset_values=massi_select_out)
dip test statistic is >0.08. This suggests that the proportion of male and female samples in this dataset is relatively balanced.
>
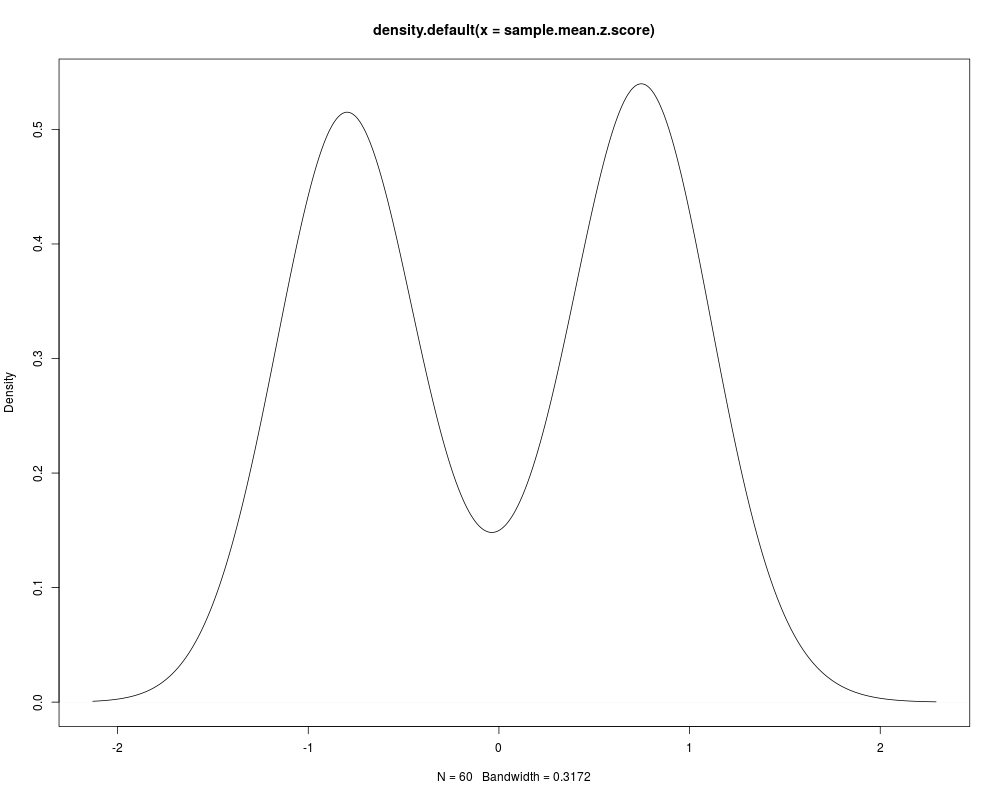
> # view a density plot
> plot(massi_dip_out[[3]])
>
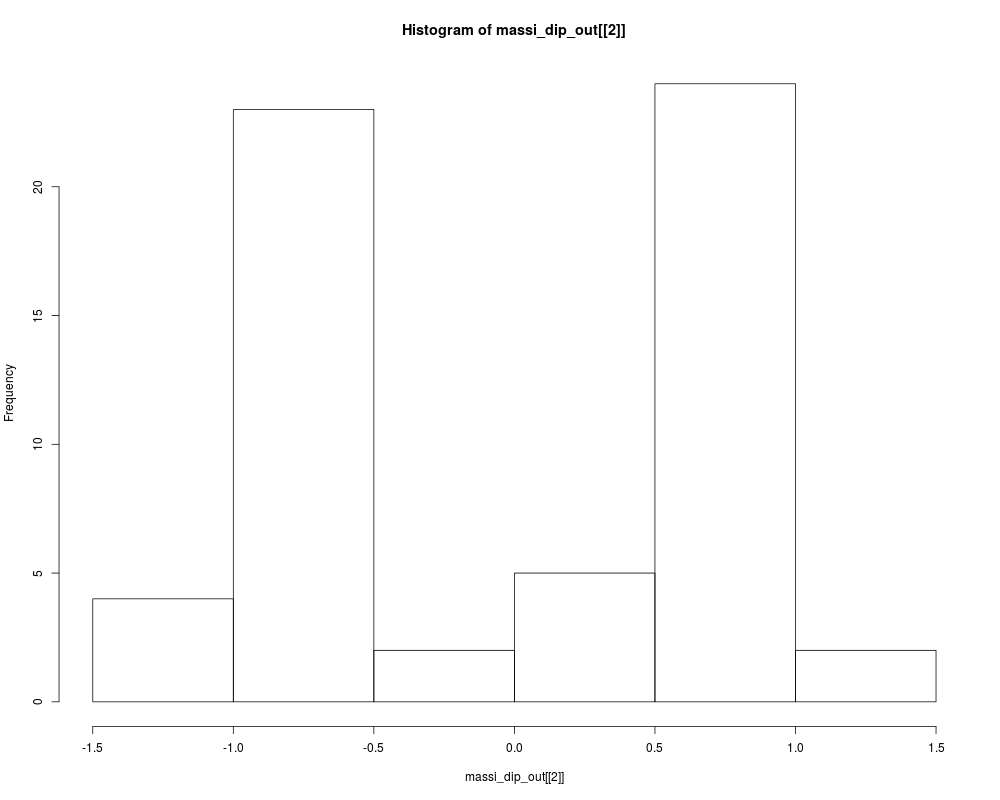
> # view a histogram of z-scores
> hist(x=massi_dip_out[[2]])
>
>
>
>
>
>
> dev.off()
null device
1
>
|