Supported by Dr. Osamu Ogasawara and  . . |
|
Last data update: 2014.03.03 |
Principal Components Analysis using Robust EstimatorsDescriptionA function that performs PCA using the robust estimators "S-estimator","MCD" and "MVE". Usage
prcomp.robust(x, robust = c("S-estimator","MCD", "MVE"),
                        nsamp = 10*nrow(x), ...)
## S3 method for class 'robust'
prcomp(x, robust = c("S-estimator","MCD", "MVE"),
                        nsamp = 10*nrow(x), ...)
Arguments
DetailsThe calculation is done by a singular value decomposition of the
robust centered and scaled data matrix, not by using
Value
Author(s)Justin Harrington harringt@stat.ubc.ca and Gabriela V. Cohen Freue gcohen@stat.ubc.ca. ReferencesCohen Freue, G. V. and Hollander, Z. and Shen, E. and Zamar, R. H. and Balshaw, R. and Scherer, A. and McManus, B. and Keown, P. and McMaster, W. R. and Ng, R. T. (2007) ‘MDQC: A New Quality Assessment Method for Microarrays Based on Quality Control Reports’. Bioinformatics 23, 3162 – 3169. See Also
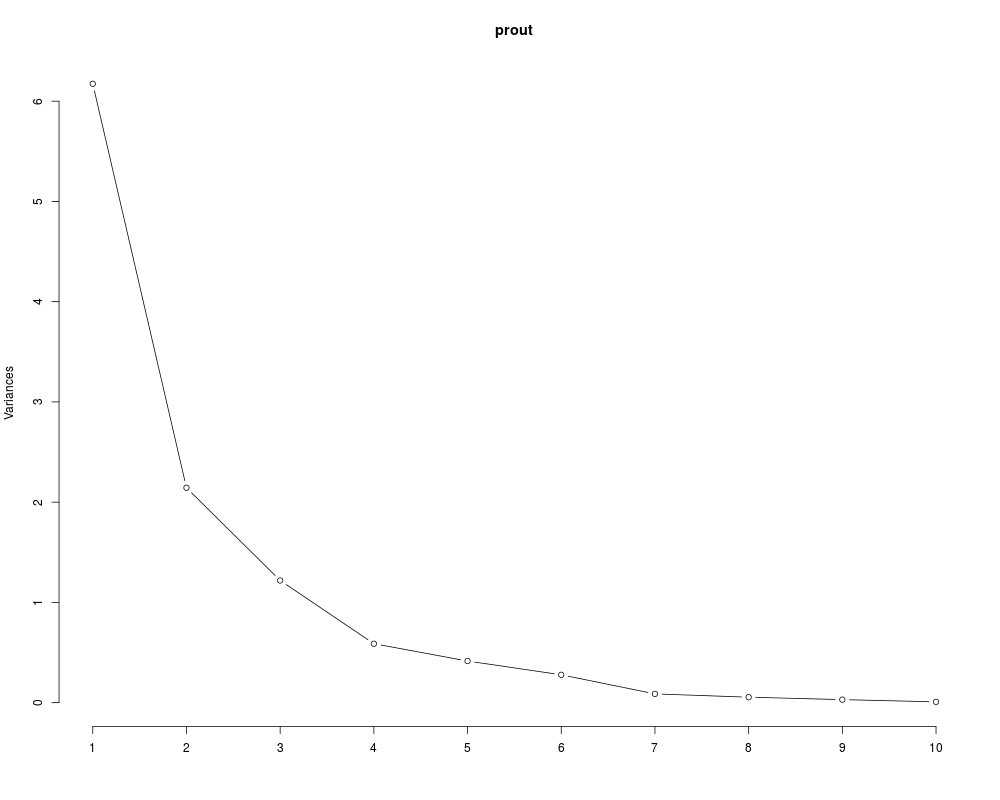
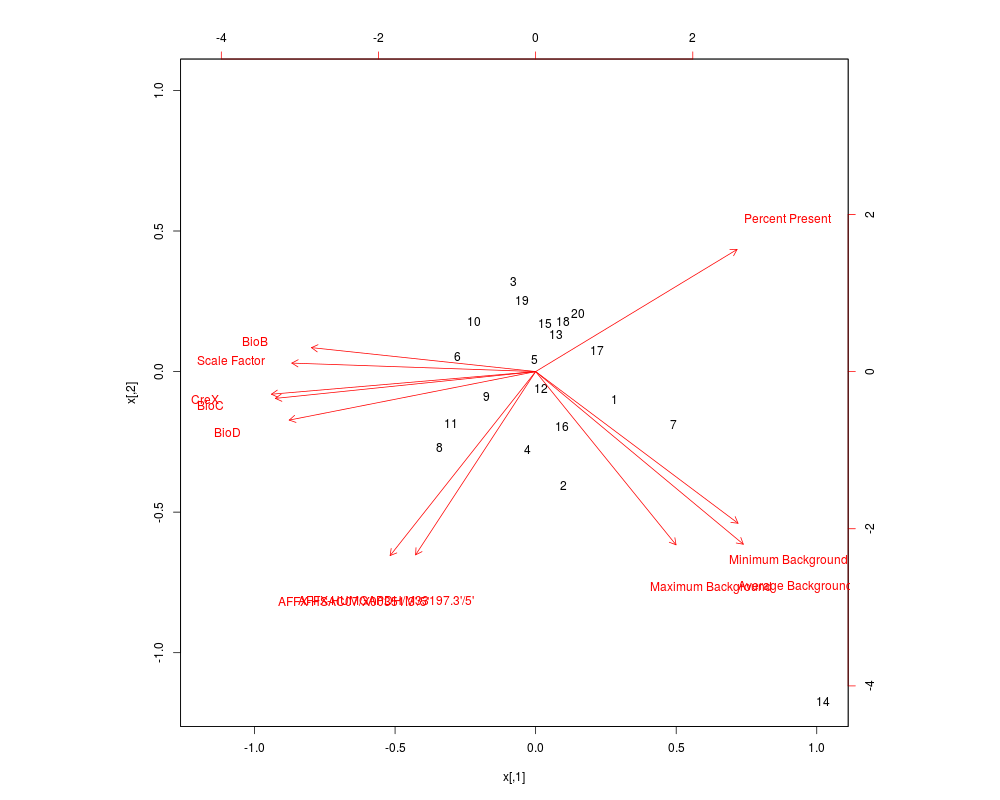
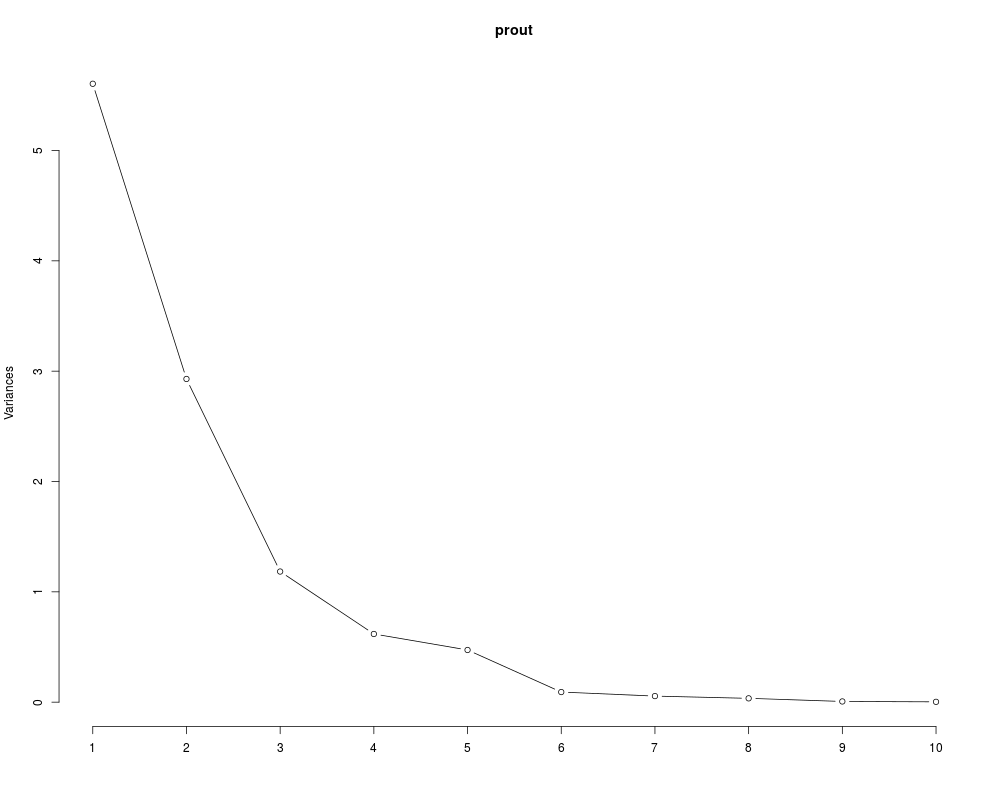
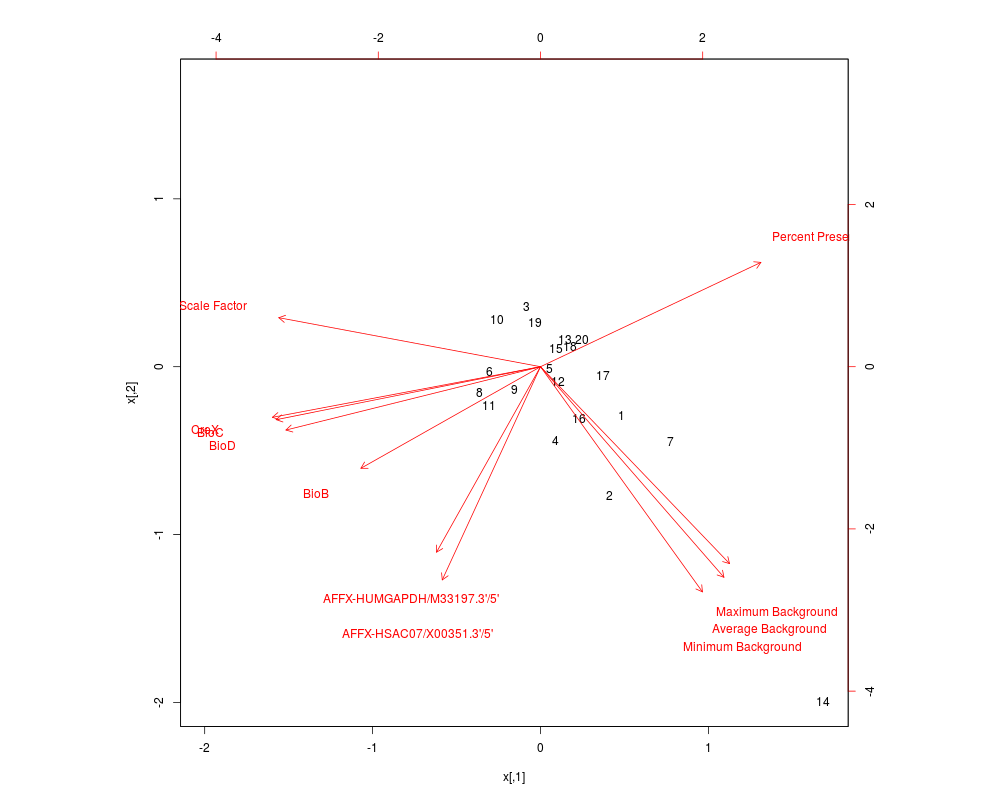
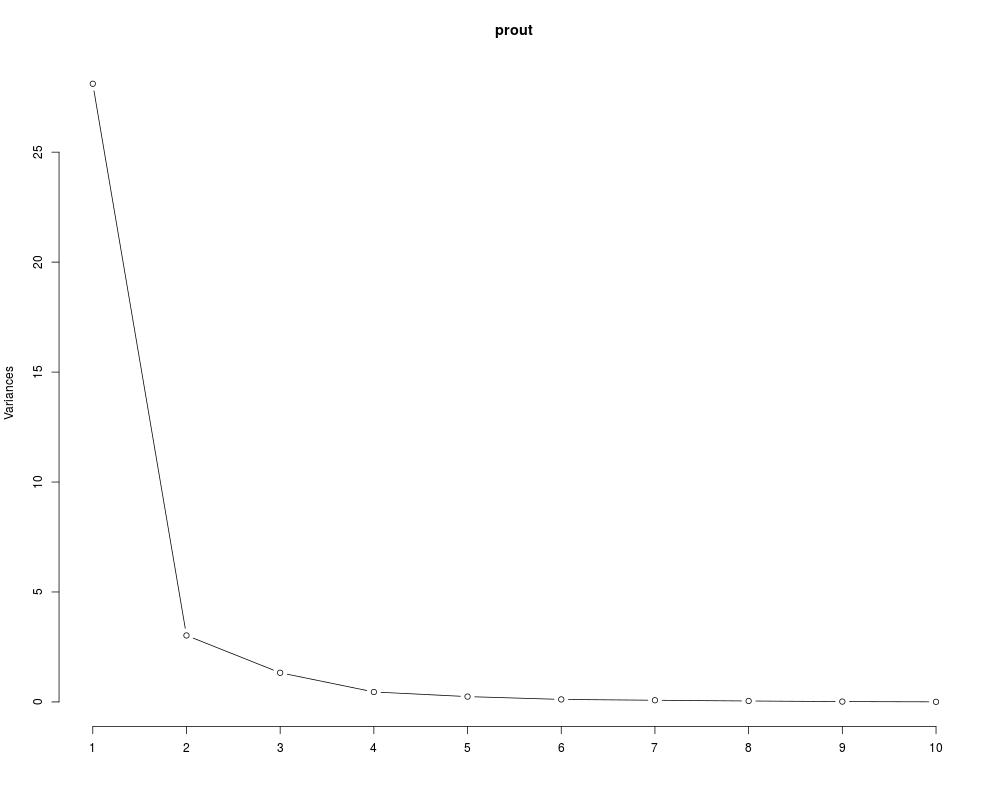
Examplesdata(allQC) ## Loads the dataset allQC prout <- prcomp.robust(allQC) screeplot(prout, type="line") biplot(prout) prout <- prcomp.robust(allQC, robust="MCD") screeplot(prout, type="line") biplot(prout) prout <- prcomp.robust(allQC, robust="MVE") screeplot(prout, type="line") biplot(prout) Results
R version 3.3.1 (2016-06-21) -- "Bug in Your Hair"
Copyright (C) 2016 The R Foundation for Statistical Computing
Platform: x86_64-pc-linux-gnu (64-bit)

R is free software and comes with ABSOLUTELY NO WARRANTY.
You are welcome to redistribute it under certain conditions.
Type 'license()' or 'licence()' for distribution details.

R is a collaborative project with many contributors.
Type 'contributors()' for more information and
'citation()' on how to cite R or R packages in publications.

Type 'demo()' for some demos, 'help()' for on-line help, or
'help.start()' for an HTML browser interface to help.
Type 'q()' to quit R.

> library(mdqc)
Loading required package: cluster
Loading required package: MASS
> png(filename="/home/ddbj/snapshot/RGM3/R_BC/result/mdqc/prcomp.robust.Rd_%03d_medium.png", width=480, height=480)
> ### Name: prcomp.robust
> ### Title: Principal Components Analysis using Robust Estimators
> ### Aliases: prcomp.robust
> ### Keywords: multivariate robust
>
> ### ** Examples
>
> data(allQC) ## Loads the dataset allQC
>
> prout <- prcomp.robust(allQC)
> screeplot(prout, type="line")
> biplot(prout)
>
> prout <- prcomp.robust(allQC, robust="MCD")
> screeplot(prout, type="line")
> biplot(prout)
>
> prout <- prcomp.robust(allQC, robust="MVE")
> screeplot(prout, type="line")
> biplot(prout)
>
>
>
>
>
> dev.off()
null device
          1
>
|