Supported by Dr. Osamu Ogasawara and  . . |
|
Last data update: 2014.03.03 |
Detect differential expression in the presence of outliersDescriptionRun the Messina algorithm to find differentially-expressed features (eg. genes) in the presence of outliers. UsagemessinaDE(x, y, max_misattribution_rate, f_train = 0.9, n_boot = 50, seed = NULL, progress = TRUE, silent = FALSE) Arguments
DetailsThe Messina classification algorithm (see main page at
Outlier differential expressionOutliers in differential expression measurements are common in many experimental contexts. They may be due to experimental errors, sample misidentification, or the presence of unknown structure (eg. disease subtypes) in what was supposed to be a homogeneous sample group. The latter two causes are particularly troublesome in clinical samples, where diagnoses can be incorrect, samples impure, and subtypes common. The effect of these outliers is to inflate within-group variance estimates, reducing the power for detecting differential expression. Messina provides a principled approach to detecting differential expression in datasets containing at most a specified level of outlier samples. Misattribution rateIn the Messina framework, for each feature each of the two classes of samples is considered to have a typical signal level. Most samples in each class will display the level of signal that matches their class, but a small number will display a level of signal consistent with the wrong class. We call these samples with signal matching the wrong class 'misattributed samples'. Messina can be tuned to ignore a given rate of sample misattribution when detecting differential expression, and therefore can be smoothly adjusted to deal with varying levels of outlier contamination in an experiment. messinaDE assumes that the probability of an outlier
sample is equal in each of the two classes. There are
situations where this assumption is likely incorrect: for
example, in a cancer vs normal comparison, the normal
samples are likely to have much more consistent
expression than the highly perturbed and variable cancer
samples. In these cases, the user can call the worker
function Author(s)Mark Pinese m.pinese@garvan.org.au ReferencesPinese M, Scarlett CJ, Kench JG, et al. (2009) Messina: A Novel Analysis Tool to Identify Biologically Relevant Molecules in Disease. PLoS ONE 4(4): e5337. doi:10.1371/journal.pone.0005337 See Also
Examples
## Load some example data
library(antiProfilesData)
data(apColonData)

x = exprs(apColonData)
y = pData(apColonData)$SubType

## Subset the data to only tumour and normal samples
sel = y %in% c("normal", "tumor")
x = x[,sel]
y = y[sel]

## Find differentially-expressed probesets.  Allow a sample misattribution rate of
## at most 20%.
fit = messinaDE(x, y == "tumor", max_misattribution_rate = 0.2)

## Display the results.
fit
plot(fit)
Results
R version 3.3.1 (2016-06-21) -- "Bug in Your Hair"
Copyright (C) 2016 The R Foundation for Statistical Computing
Platform: x86_64-pc-linux-gnu (64-bit)
R is free software and comes with ABSOLUTELY NO WARRANTY.
You are welcome to redistribute it under certain conditions.
Type 'license()' or 'licence()' for distribution details.
R is a collaborative project with many contributors.
Type 'contributors()' for more information and
'citation()' on how to cite R or R packages in publications.
Type 'demo()' for some demos, 'help()' for on-line help, or
'help.start()' for an HTML browser interface to help.
Type 'q()' to quit R.
> library(messina)
Loading required package: survival
> png(filename="/home/ddbj/snapshot/RGM3/R_BC/result/messina/messinaDE.Rd_%03d_medium.png", width=480, height=480)
> ### Name: messinaDE
> ### Title: Detect differential expression in the presence of outliers
> ### Aliases: messinaDE
>
> ### ** Examples
>
> ## Load some example data
> library(antiProfilesData)
Loading required package: Biobase
Loading required package: BiocGenerics
Loading required package: parallel
Attaching package: 'BiocGenerics'
The following objects are masked from 'package:parallel':
clusterApply, clusterApplyLB, clusterCall, clusterEvalQ,
clusterExport, clusterMap, parApply, parCapply, parLapply,
parLapplyLB, parRapply, parSapply, parSapplyLB
The following objects are masked from 'package:stats':
IQR, mad, xtabs
The following objects are masked from 'package:base':
Filter, Find, Map, Position, Reduce, anyDuplicated, append,
as.data.frame, cbind, colnames, do.call, duplicated, eval, evalq,
get, grep, grepl, intersect, is.unsorted, lapply, lengths, mapply,
match, mget, order, paste, pmax, pmax.int, pmin, pmin.int, rank,
rbind, rownames, sapply, setdiff, sort, table, tapply, union,
unique, unsplit
Welcome to Bioconductor
Vignettes contain introductory material; view with
'browseVignettes()'. To cite Bioconductor, see
'citation("Biobase")', and for packages 'citation("pkgname")'.
> data(apColonData)
>
> x = exprs(apColonData)
> y = pData(apColonData)$SubType
>
> ## Subset the data to only tumour and normal samples
> sel = y %in% c("normal", "tumor")
> x = x[,sel]
> y = y[sel]
>
> ## Find differentially-expressed probesets. Allow a sample misattribution rate of
> ## at most 20%.
> fit = messinaDE(x, y == "tumor", max_misattribution_rate = 0.2)
Performance bootstrapping...
0% [ ] 2% [= ] 4% [== ] 6% [=== ] 8% [==== ] 9% [===== ] 11% [====== ] 13% [======= ] 15% [========= ] 17% [========== ] 19% [=========== ] 21% [============ ] 22% [============= ] 24% [============== ] 26% [=============== ] 28% [================ ] 30% [================= ] 32% [=================== ] 34% [==================== ] 36% [===================== ] 37% [====================== ] 39% [======================= ] 41% [======================== ] 43% [========================= ] 45% [========================== ] 47% [============================ ] 49% [============================= ] 51% [============================== ] 52% [=============================== ] 54% [================================ ] 56% [================================= ] 58% [================================== ] 60% [=================================== ] 62% [===================================== ] 64% [====================================== ] 66% [======================================= ] 67% [======================================== ] 69% [========================================= ] 71% [========================================== ] 73% [=========================================== ] 75% [============================================ ] 77% [============================================== ] 79% [=============================================== ] 81% [================================================ ] 82% [================================================= ] 84% [================================================== ] 86% [=================================================== ] 88% [==================================================== ] 90% [===================================================== ] 92% [======================================================= ] 94% [======================================================== ] 96% [========================================================= ] 97% [========================================================== ] 99% [=========================================================== ] 100% [============================================================]
>
> ## Display the results.
> fit
An object of class MessinaClassResult
Problem type:classification
Parameters:
An object of class MessinaParameters
5339 features, 38 samples.
Objective type: sensitivity/specificity. Minimum sensitivity: 0.8 Minimum specificity: 0.8
Minimum group fraction: 0
Training fraction: 0.9
Number of bootstraps: 50
Random seed:
Summary of results:
An object of class MessinaFits
610 / 5339 features passed performance requirements (11.43%)
Top features:
Passed Requirements Classifier Type Threshold Value Direction
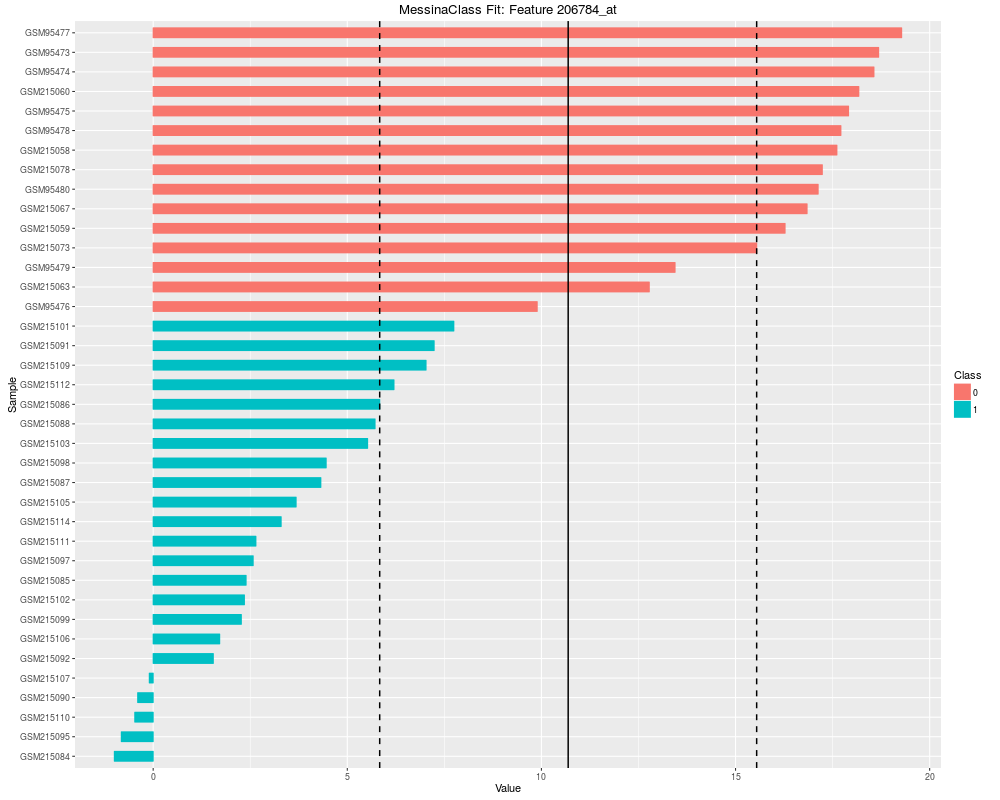
206784_at TRUE Threshold 10.689311 -1
207502_at TRUE Threshold 6.835522 -1
206422_at TRUE Threshold 8.839170 -1
209613_s_at TRUE Threshold 7.412960 -1
207003_at TRUE Threshold 9.558430 -1
204719_at TRUE Threshold 6.095796 -1
209735_at TRUE Threshold 5.467084 -1
220834_at TRUE Threshold 13.383229 -1
213921_at TRUE Threshold 4.160415 -1
209612_s_at TRUE Threshold 7.685667 -1
Margin
206784_at 9.709529
207502_at 9.212592
206422_at 9.061072
209613_s_at 8.797458
207003_at 8.396076
204719_at 7.985464
209735_at 7.729767
220834_at 7.644725
213921_at 7.633863
209612_s_at 7.393653
> plot(fit)
Warning message:
Stacking not well defined when ymin != 0
>
>
>
>
>
> dev.off()
null device
1
>
|