Supported by Dr. Osamu Ogasawara and  . . |
|
Last data update: 2014.03.03 |
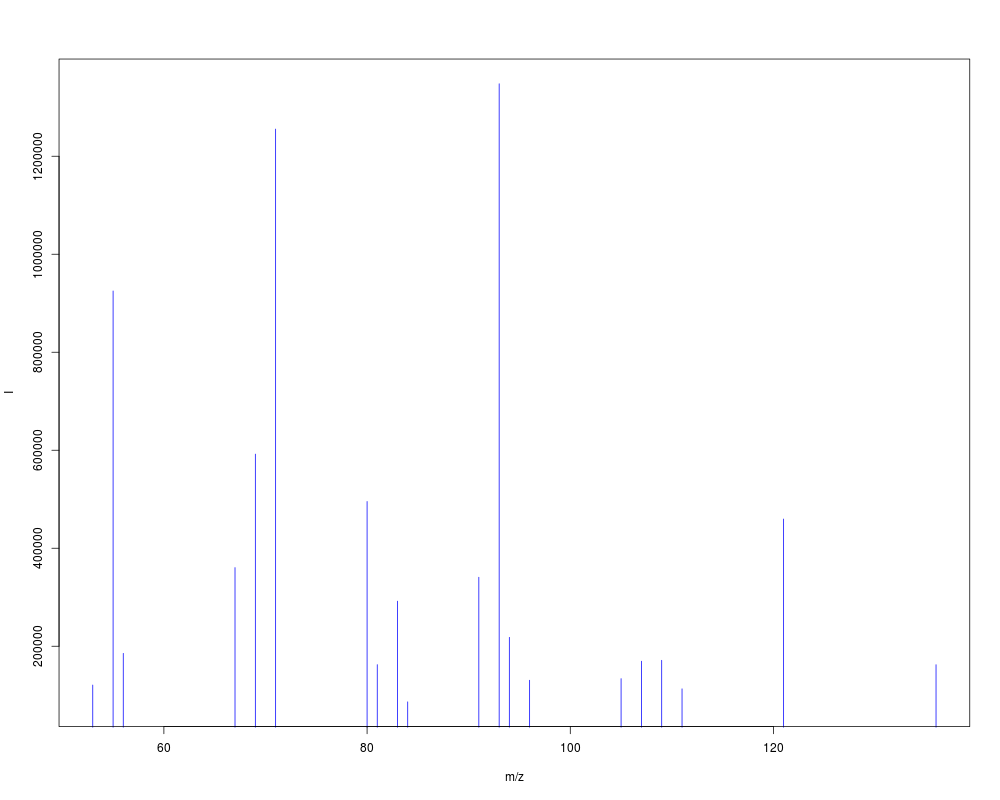
Plot a pseudospectrum.DescriptionAuxiliary function for plotting a particular pseudospectrum. M/z values are in the first column of the matrix, and an intensity measure (either maxo, into or something else) in the second. The third column is disregarded, usually contains retention time information UsageplotPseudoSpectrum(psspc, ...) Arguments
DetailsA stick spectrum is shown on the graphical device. Author(s)Ron Wehrens Examples
data("threeStdsDB")
plotPseudoSpectrum(DB[[1]]$pspectrum)
Results
R version 3.3.1 (2016-06-21) -- "Bug in Your Hair"
Copyright (C) 2016 The R Foundation for Statistical Computing
Platform: x86_64-pc-linux-gnu (64-bit)

R is free software and comes with ABSOLUTELY NO WARRANTY.
You are welcome to redistribute it under certain conditions.
Type 'license()' or 'licence()' for distribution details.

R is a collaborative project with many contributors.
Type 'contributors()' for more information and
'citation()' on how to cite R or R packages in publications.

Type 'demo()' for some demos, 'help()' for on-line help, or
'help.start()' for an HTML browser interface to help.
Type 'q()' to quit R.

> library(metaMS)
Loading required package: CAMERA
Loading required package: Biobase
Loading required package: BiocGenerics
Loading required package: parallel

Attaching package: 'BiocGenerics'

The following objects are masked from 'package:parallel':

    clusterApply, clusterApplyLB, clusterCall, clusterEvalQ,
    clusterExport, clusterMap, parApply, parCapply, parLapply,
    parLapplyLB, parRapply, parSapply, parSapplyLB

The following objects are masked from 'package:stats':

    IQR, mad, xtabs

The following objects are masked from 'package:base':

    Filter, Find, Map, Position, Reduce, anyDuplicated, append,
    as.data.frame, cbind, colnames, do.call, duplicated, eval, evalq,
    get, grep, grepl, intersect, is.unsorted, lapply, lengths, mapply,
    match, mget, order, paste, pmax, pmax.int, pmin, pmin.int, rank,
    rbind, rownames, sapply, setdiff, sort, table, tapply, union,
    unique, unsplit

Welcome to Bioconductor

    Vignettes contain introductory material; view with
    'browseVignettes()'. To cite Bioconductor, see
    'citation("Biobase")', and for packages 'citation("pkgname")'.

Loading required package: xcms
Loading required package: mzR
Loading required package: Rcpp
Loading required package: ProtGenerics

Attaching package: 'xcms'

The following objects are masked from 'package:Biobase':

    phenoData, phenoData<-

> png(filename="/home/ddbj/snapshot/RGM3/R_BC/result/metaMS/plotPseudoSpectrum.Rd_%03d_medium.png", width=480, height=480)
> ### Name: plotPseudoSpectrum
> ### Title: Plot a pseudospectrum.
> ### Aliases: plotPseudoSpectrum
> ### Keywords: manip
>
> ### ** Examples
>
> data("threeStdsDB")
> plotPseudoSpectrum(DB[[1]]$pspectrum)
>
>
>
>
>
> dev.off()
null device
          1
>
|
Created & Maintained by Osamu Ogasawara (osamu.ogasawara@gmail.com) and 