Supported by Dr. Osamu Ogasawara and  . . |
|
Last data update: 2014.03.03 |
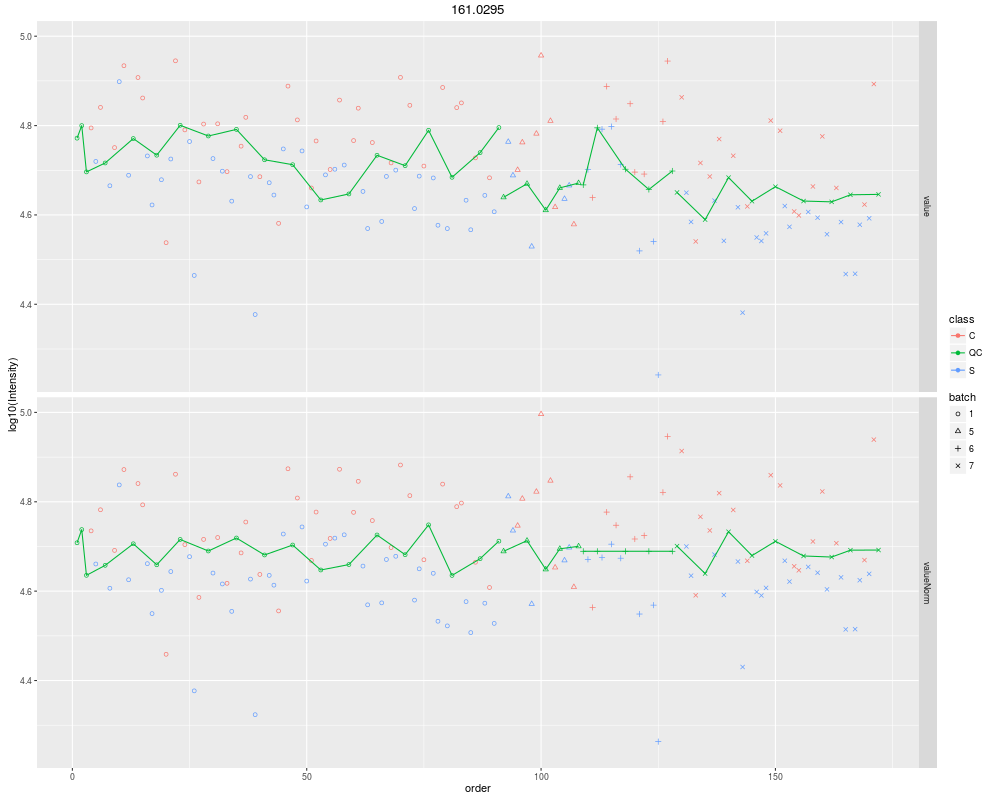
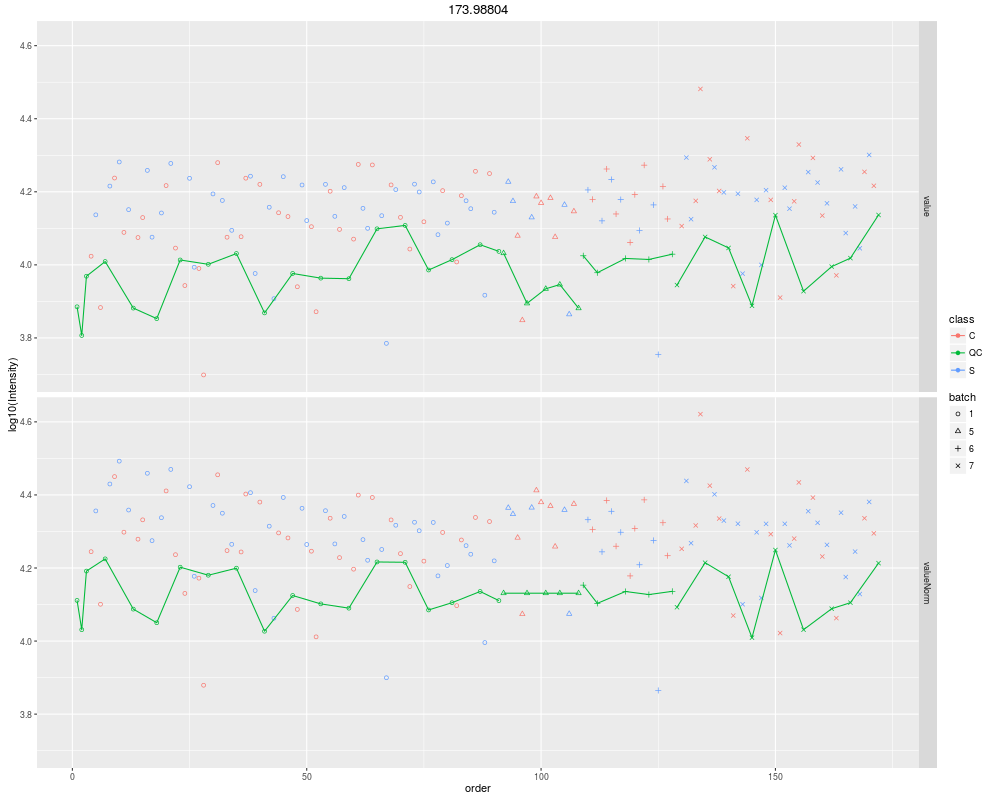
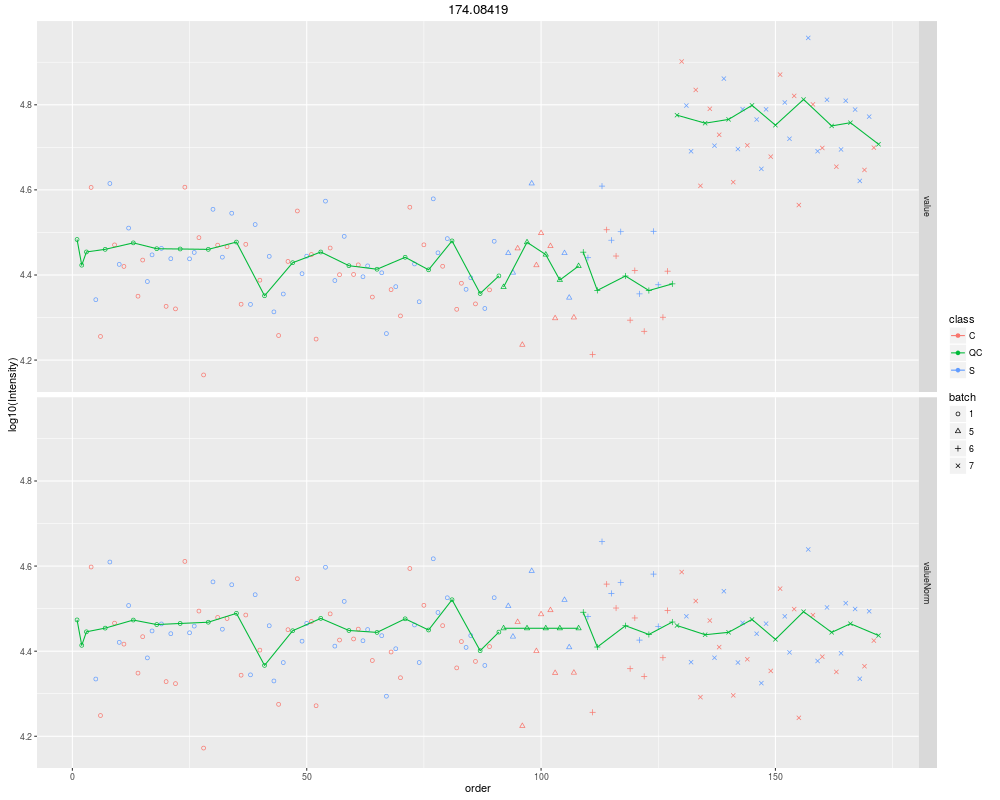
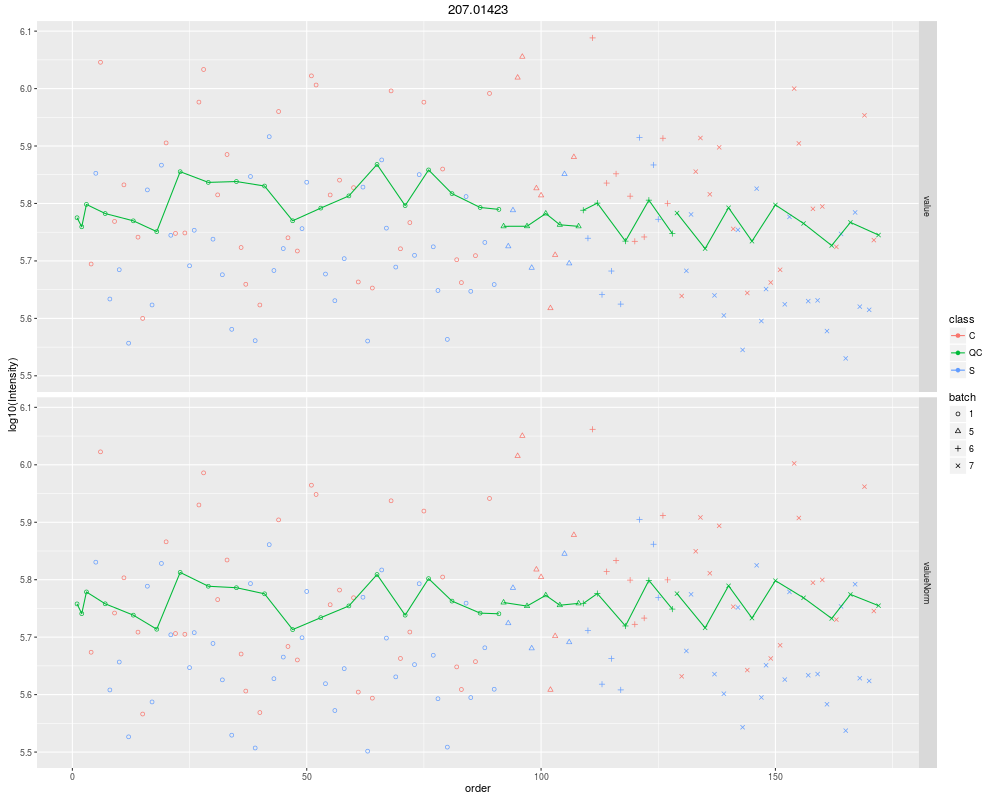
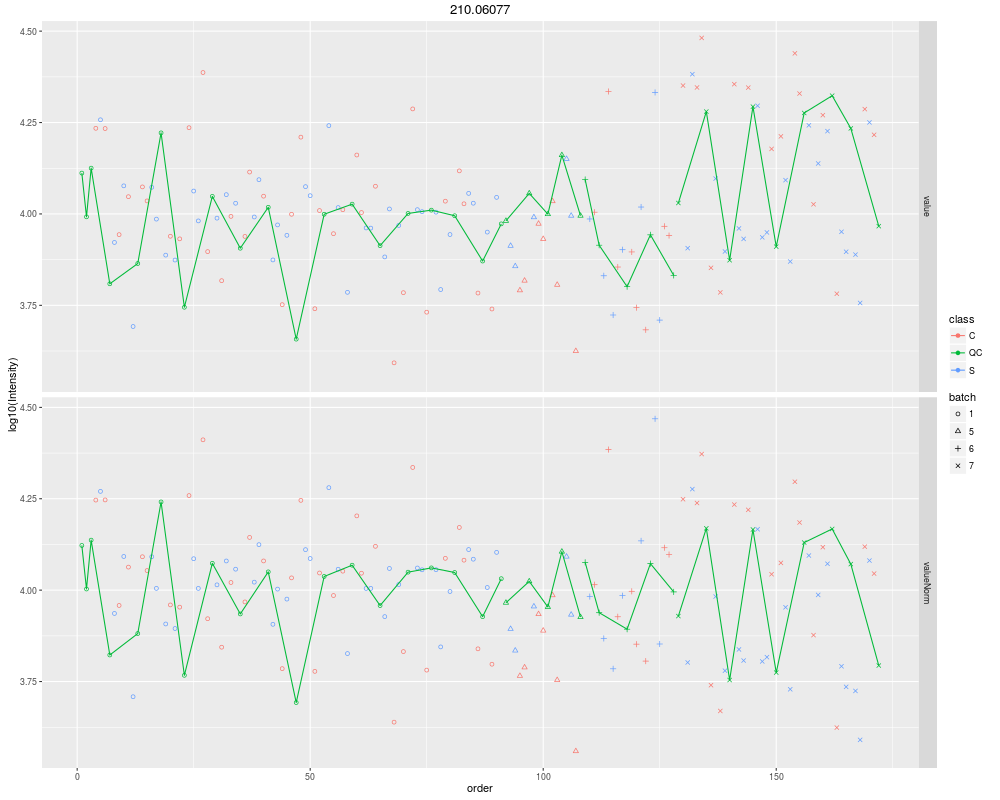
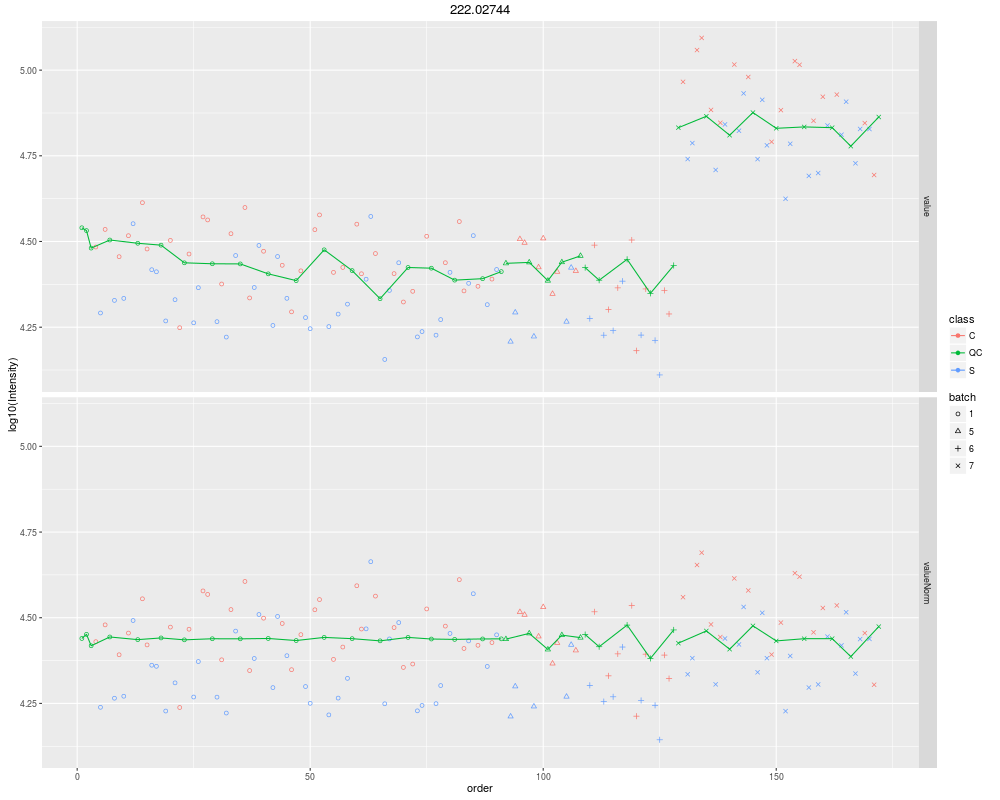
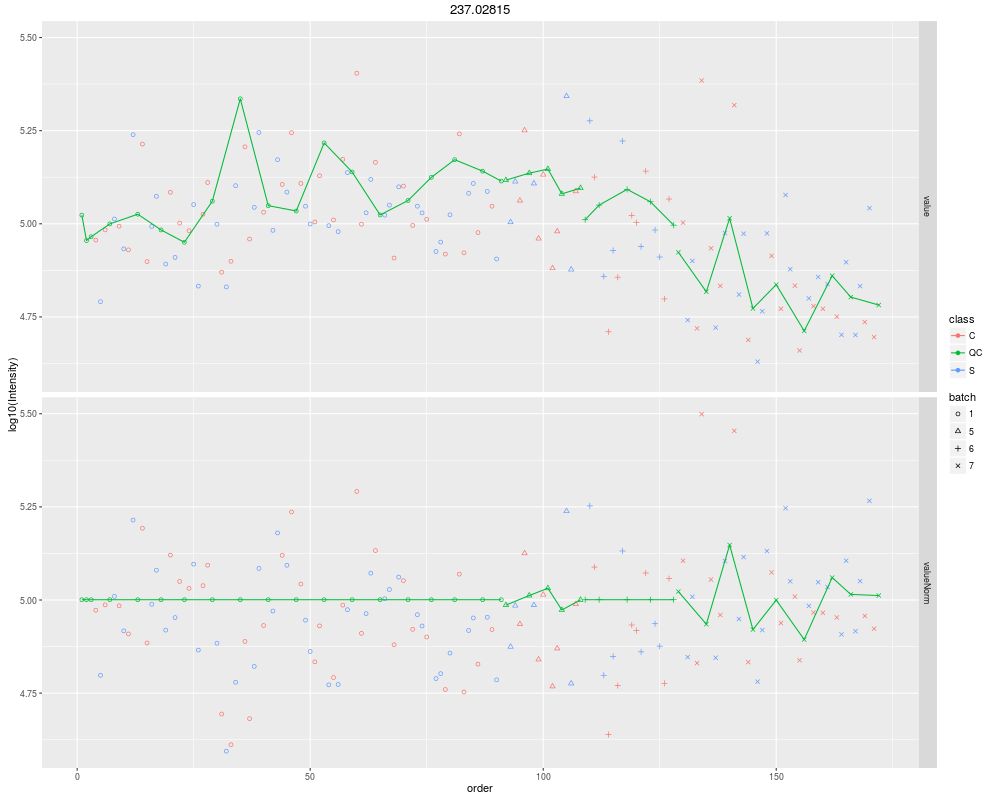
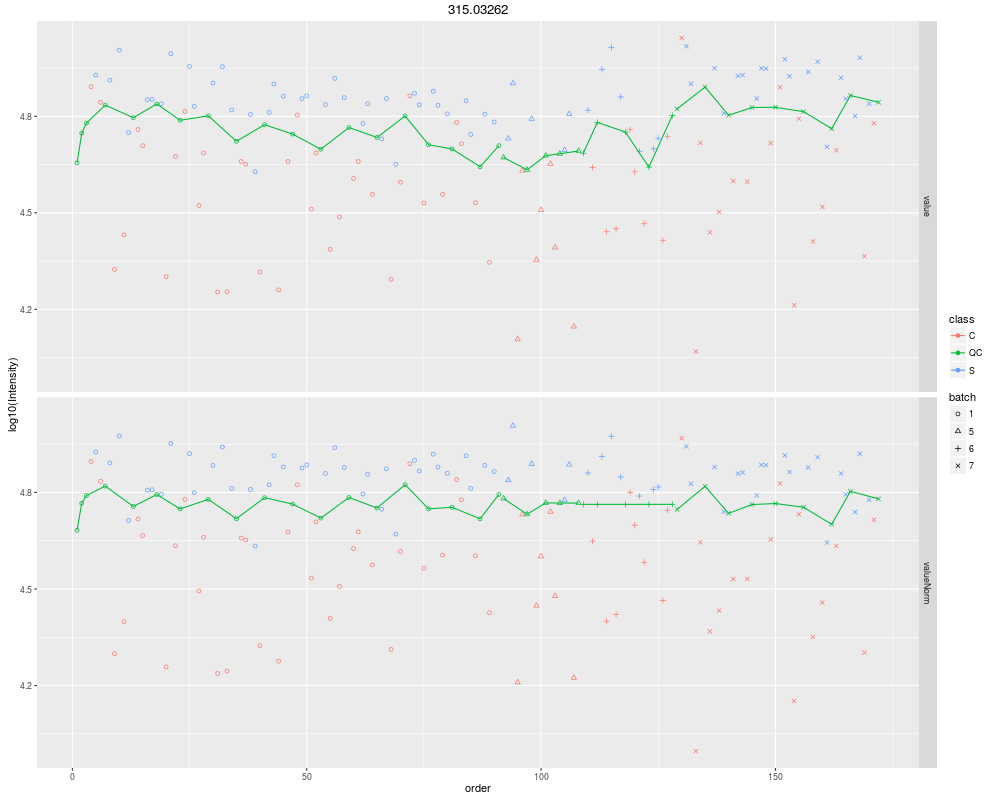
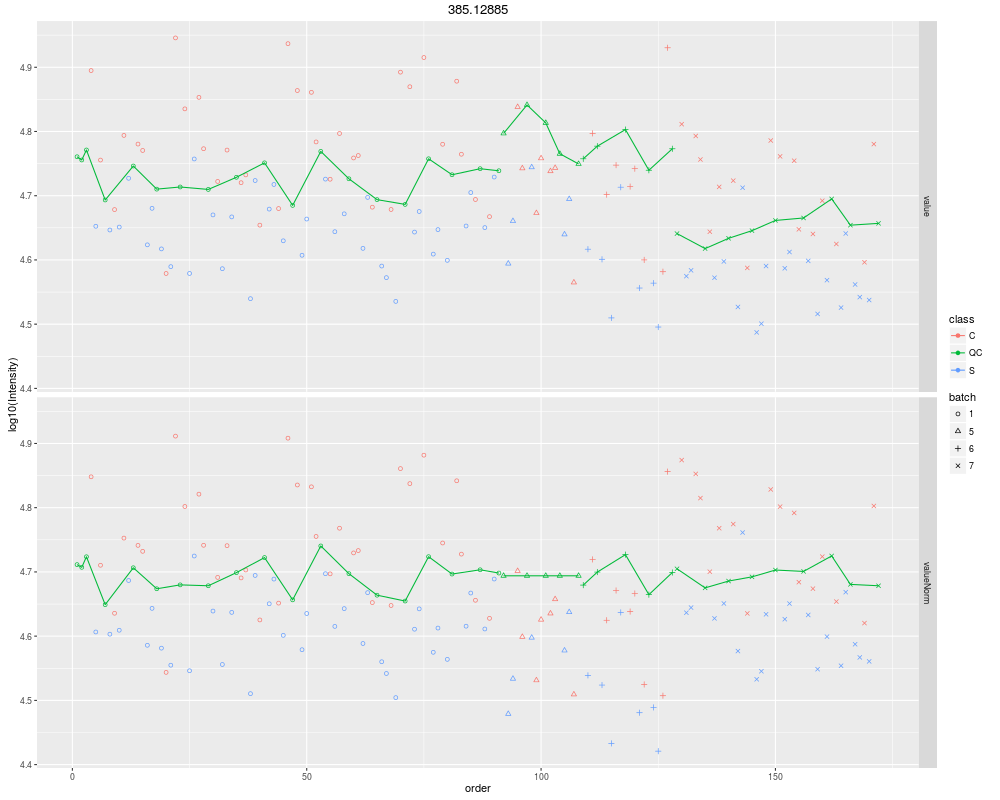
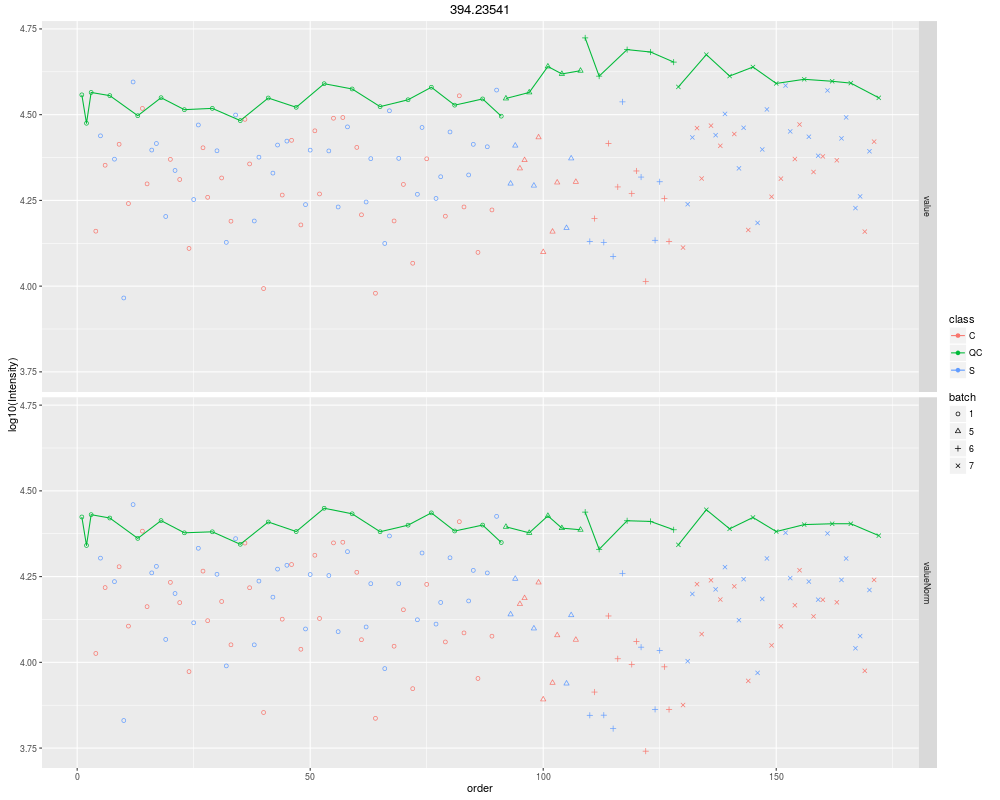
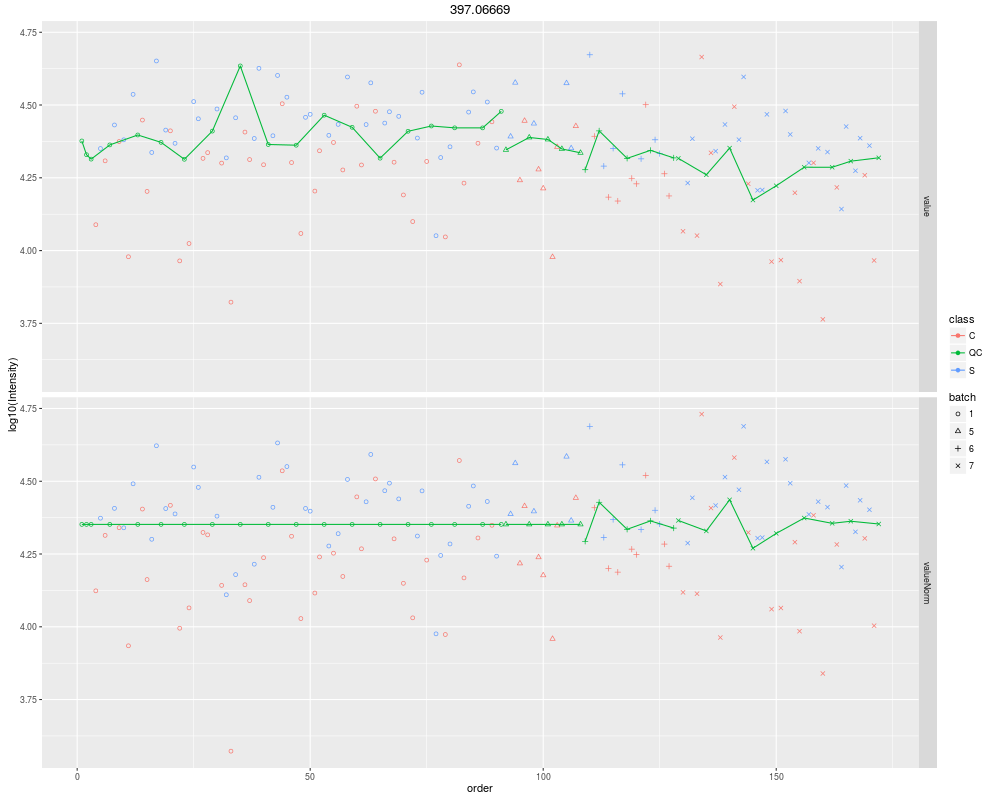
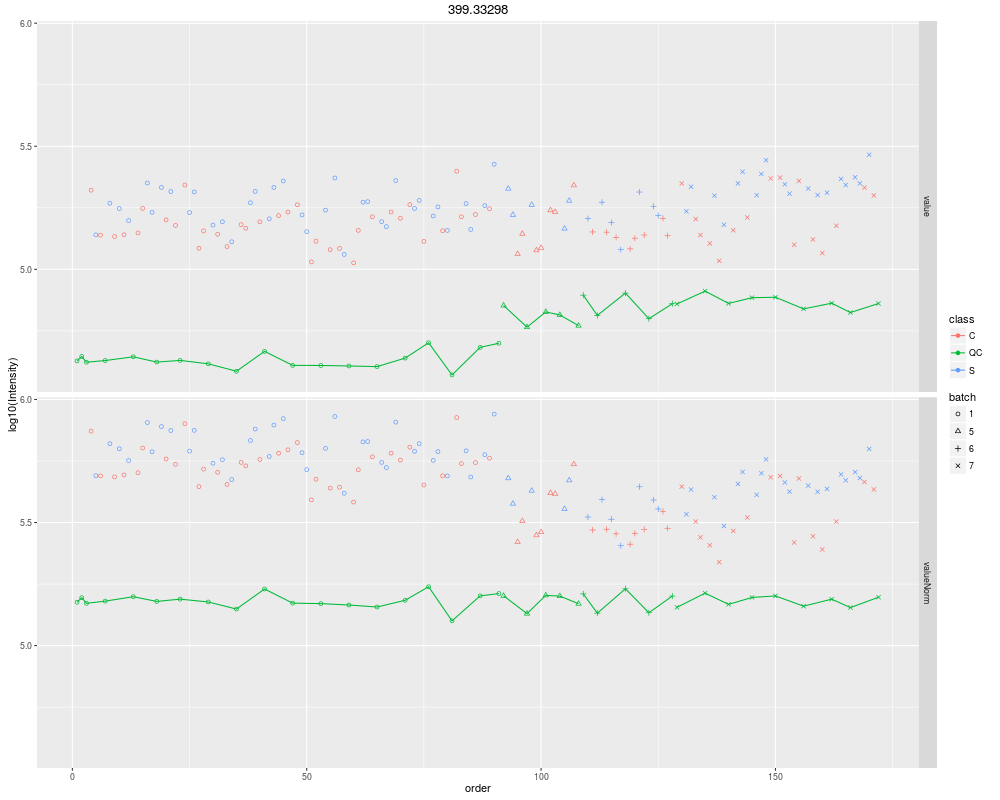
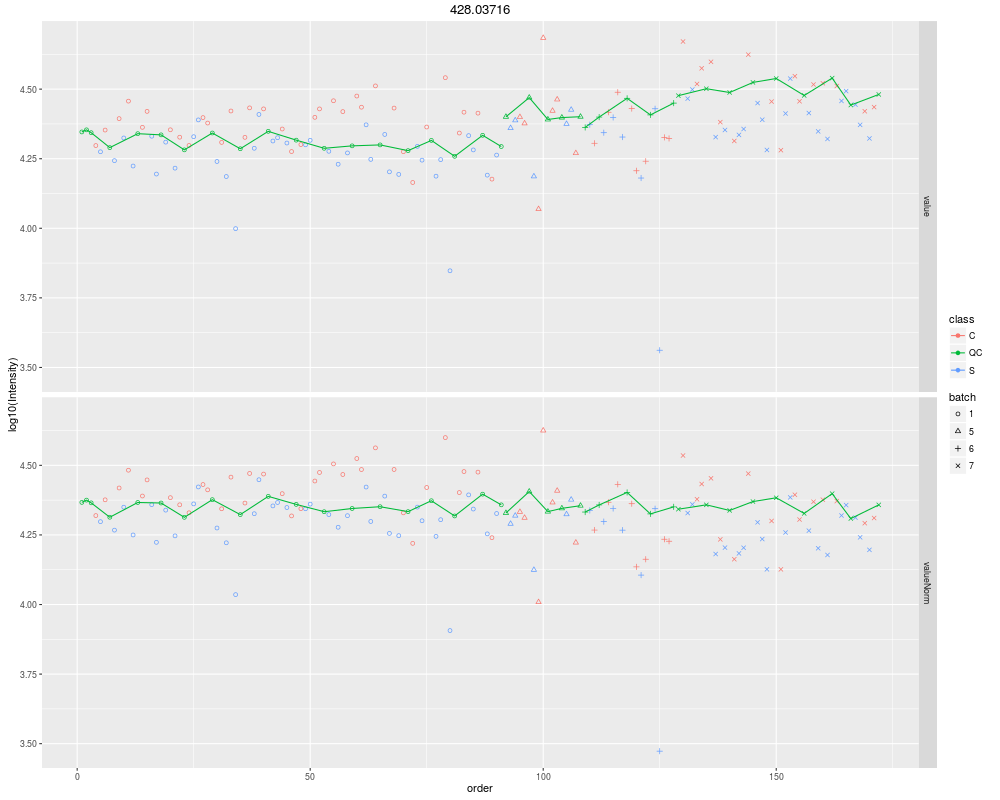
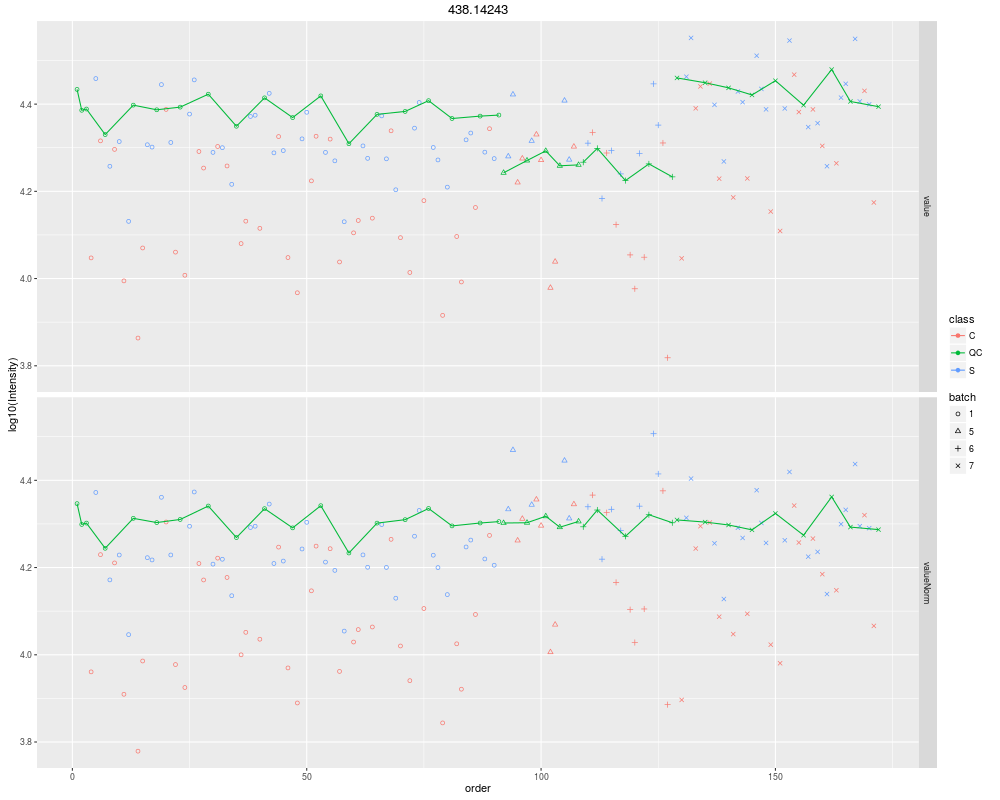
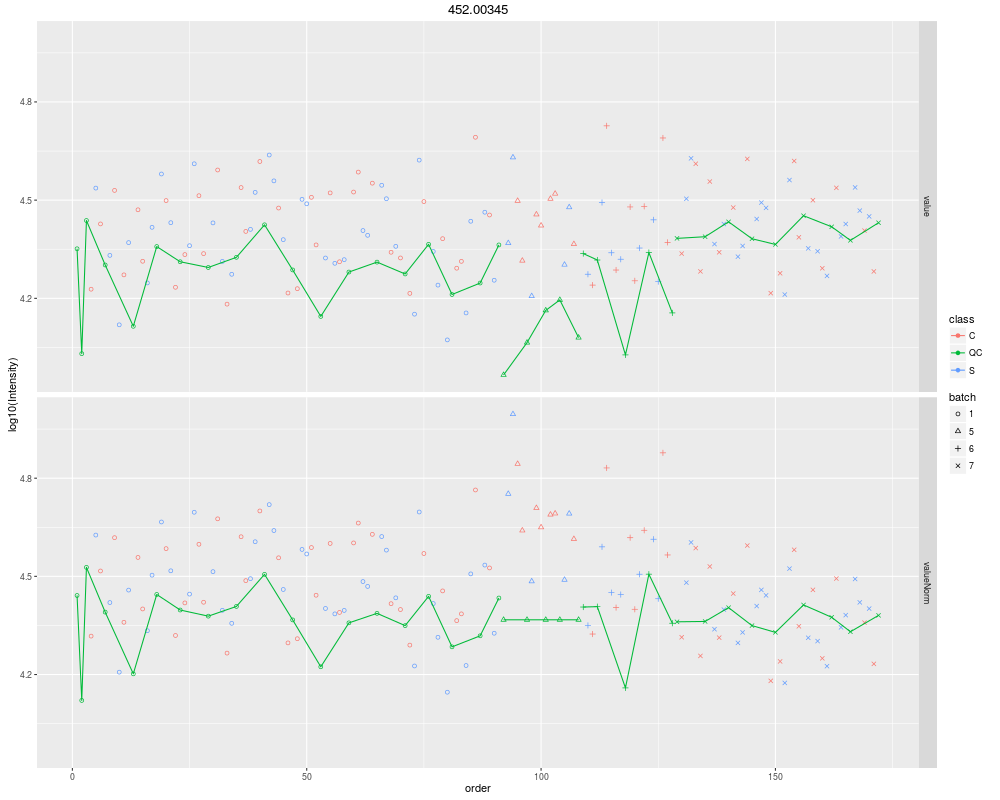
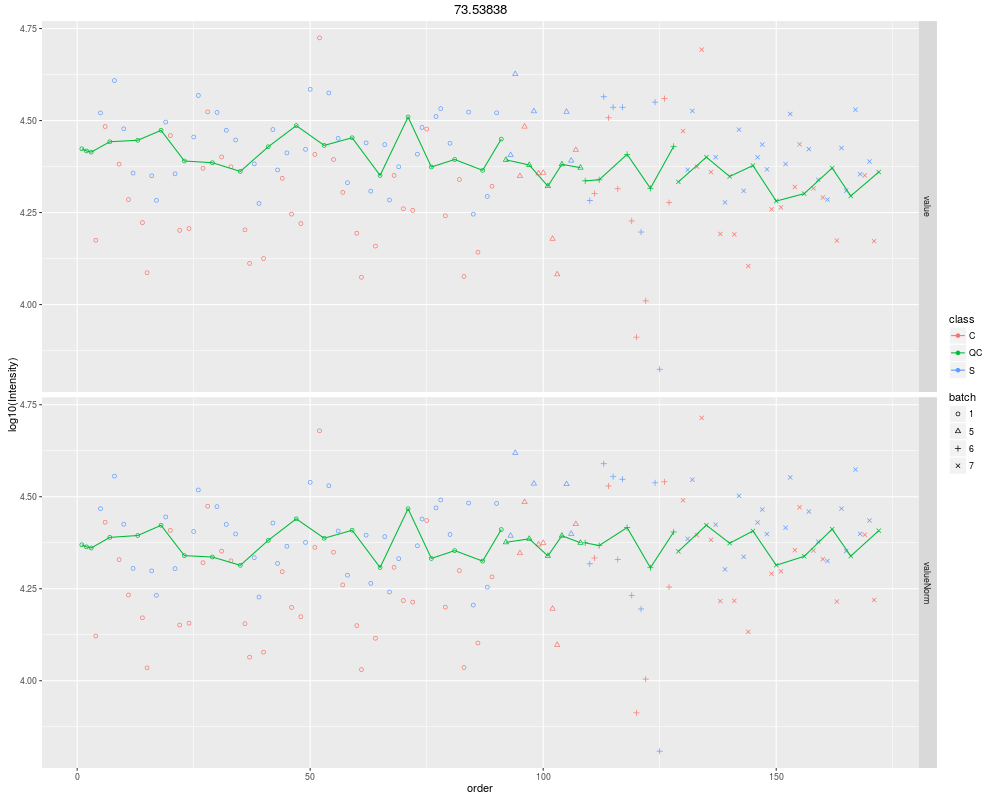
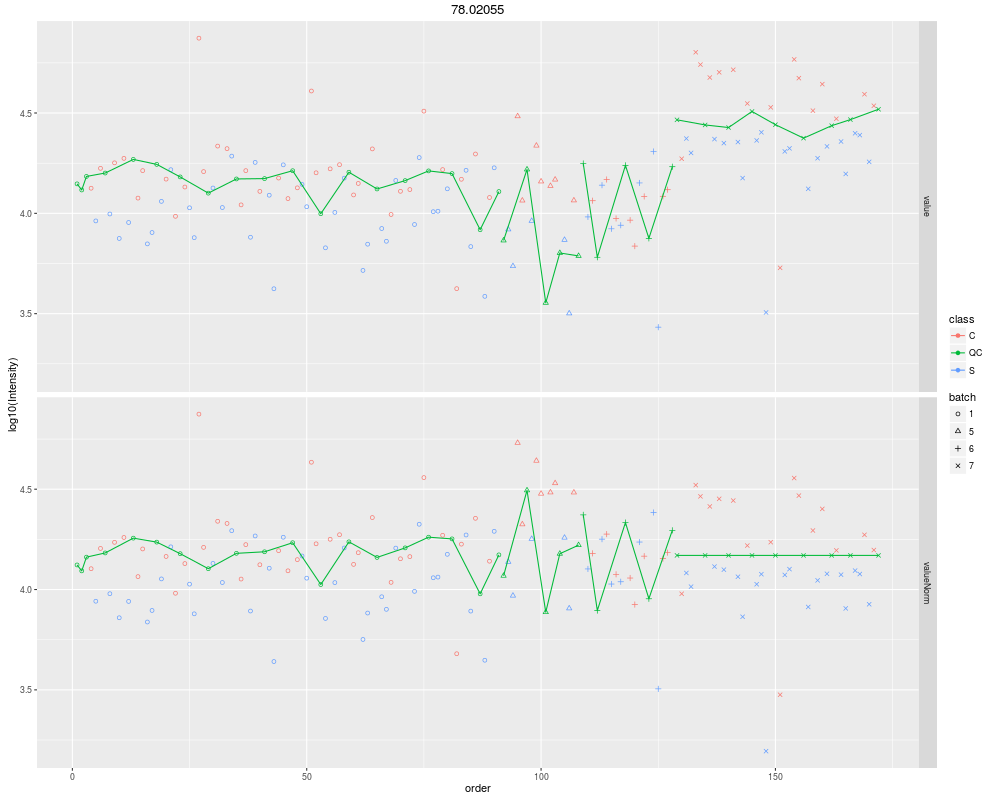
Plot figures for QC-RLSCDescriptionPlot figures for QC-RLSC UsageplotQCRLSC(para, maxf = 100) Arguments
Valuenone Author(s)Bo Wen wenbo@genomics.cn See Also
Examples
para <- new("metaXpara")
pfile <- system.file("extdata/MTBLS79.txt",package = "metaX")
sfile <- system.file("extdata/MTBLS79_sampleList.txt",package = "metaX")
rawPeaks(para) <- read.delim(pfile,check.names = FALSE)[1:20,]
sampleListFile(para) <- sfile
para <- reSetPeaksData(para)
para <- missingValueImpute(para)
res <- doQCRLSC(para,cpu=1)
plotQCRLSC(res$metaXpara)
Results
R version 3.3.1 (2016-06-21) -- "Bug in Your Hair"
Copyright (C) 2016 The R Foundation for Statistical Computing
Platform: x86_64-pc-linux-gnu (64-bit)

R is free software and comes with ABSOLUTELY NO WARRANTY.
You are welcome to redistribute it under certain conditions.
Type 'license()' or 'licence()' for distribution details.

R is a collaborative project with many contributors.
Type 'contributors()' for more information and
'citation()' on how to cite R or R packages in publications.

Type 'demo()' for some demos, 'help()' for on-line help, or
'help.start()' for an HTML browser interface to help.
Type 'q()' to quit R.

> library(metaX)
Loading required package: VennDiagram
Loading required package: grid
Loading required package: futile.logger
Loading required package: pROC
Type 'citation("pROC")' for a citation.

Attaching package: 'pROC'

The following objects are masked from 'package:stats':

    cov, smooth, var

Loading required package: SSPA
Loading required package: qvalue
Loading required package: lattice
Loading required package: limma

Attaching package: 'metaX'

The following object is masked from 'package:xcms':

    plotQC

The following objects are masked from 'package:BiocGenerics':

    normalize, plotPCA

Warning message:
Package 'metaX' is deprecated and will be removed from Bioconductor
  version 3.3
> png(filename="/home/ddbj/snapshot/RGM3/R_BC/result/metaX/plotQCRLSC.Rd_%03d_medium.png", width=480, height=480)
> ### Name: plotQCRLSC
> ### Title: Plot figures for QC-RLSC
> ### Aliases: plotQCRLSC
>
> ### ** Examples
>
> para <- new("metaXpara")
> pfile <- system.file("extdata/MTBLS79.txt",package = "metaX")
> sfile <- system.file("extdata/MTBLS79_sampleList.txt",package = "metaX")
> rawPeaks(para) <- read.delim(pfile,check.names = FALSE)[1:20,]
> sampleListFile(para) <- sfile
> para <- reSetPeaksData(para)
> para <- missingValueImpute(para)
missingValueImpute: value
Wed Jul  6 21:55:01 2016	Missing value imputation for 'value'
Missing value in total: 121
Missing value in QC sample: 18
Missing value in non-QC sample: 103
Wed Jul  6 21:55:01 2016	The ratio of missing value: 3.5174%
<=0: 0
Missing value in total after missing value inputation: 0
<=0 value in total after missing value inputation: 0
> res <- doQCRLSC(para,cpu=1)
Using cpu: 1
The number of NA value in peaksData before QC-RLSC: 0
QC-RLSC loess span= 0
Wed Jul  6 21:55:06 2016	smooth fitting ...
Wed Jul  6 21:55:07 2016	smooth fitting done.
change value which ==0 to NA
The number of NA value in peaksData after QC-RLSC:0
Wed Jul  6 21:55:07 2016	Do missing value imputation after QC-RLSC...
missingValueImpute: valueNorm
Wed Jul  6 21:55:07 2016	Missing value imputation for 'valueNorm'
Missing value in total: 0
Missing value in QC sample: 0
Missing value in non-QC sample: 0
Wed Jul  6 21:55:07 2016	The ratio of missing value: 0.0000%
<=0: 0
Missing value in total after missing value inputation: 0
<=0 value in total after missing value inputation: 0
Summary information of the CV for QC samples:
  batch     CV lessThan30 total ratio
1     1  rawCV         20    20  1.00
2     1 normCV         20    20  1.00
3     5  rawCV         19    20  0.95
4     5 normCV         19    20  0.95
5     6  rawCV         18    20  0.90
6     6 normCV         19    20  0.95
7     7  rawCV         18    20  0.90
8     7 normCV         18    20  0.90


Summary information of the CV for QC samples:
      CV lessThan30 total ratio
1  rawCV         15    20  0.75
2 normCV         19    20  0.95


Filter peaks with CV > 0.3!
1
> plotQCRLSC(res$metaXpara)
$fig
[1] ".//metaX-QC-RLSC.png"

$highfig
[1] ".//metaX-QC-RLSC.pdf"

>
>
>
>
>
> dev.off()
null device
          1
>
|

Created & Maintained by Osamu Ogasawara (osamu.ogasawara@gmail.com) and 