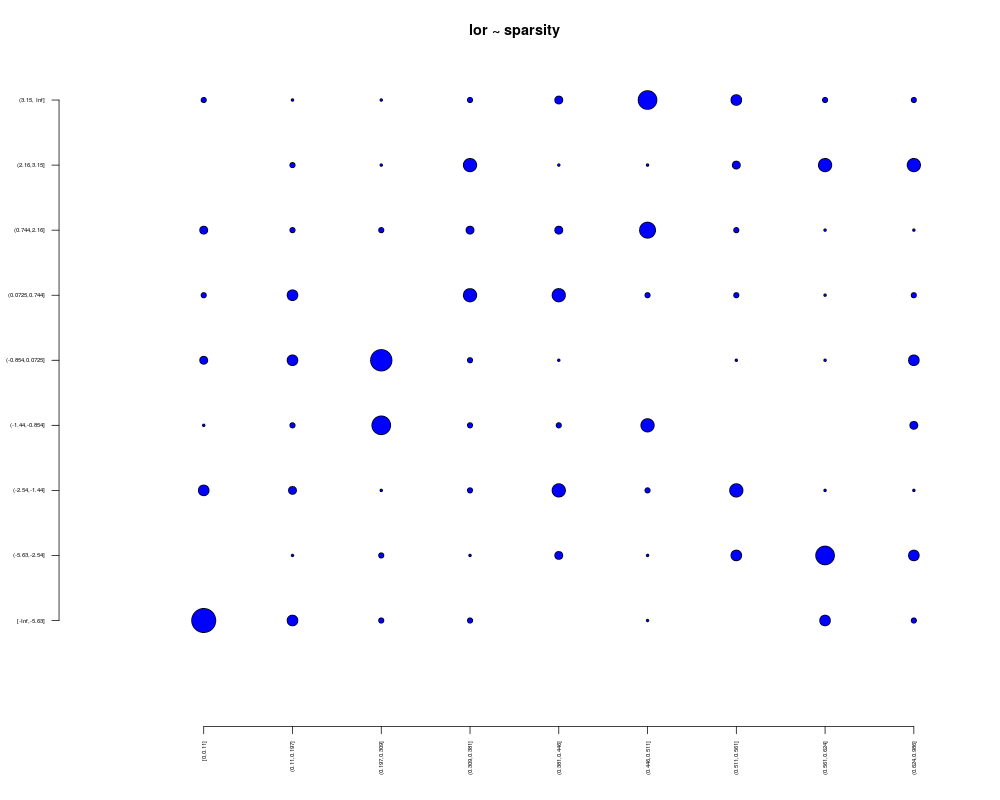
This function plots takes two vectors, calculates the contingency table and
plots circles sized by the contingency table value. Optional significance vectors
of the values significant will shade the circles by proportion of significance.
A vector of the names of significant features (names should match x/yvector).
nbreaks
Number of bins to break yvector and xvector into.
ybreak
The values to break the yvector at.
xbreak
The values to break the xvector at.
scale
Scaling of circle bin sizes.
local
Boolean to shade by signficant bin numbers (TRUE) or overall proportion (FALSE).
...
Additional plot arguments.
Value
A matrix of features along rows, and the group membership along columns.
See Also
plotMRheatmap
Examples
data(mouseData)
mouseData = mouseData[which(rowSums(mouseData)>139),]
sparsity = rowMeans(MRcounts(mouseData)==0)
lor = log(fitPA(mouseData,cl=pData(mouseData)[,3])$oddsRatio)
plotBubble(lor,sparsity,main="lor ~ sparsity")
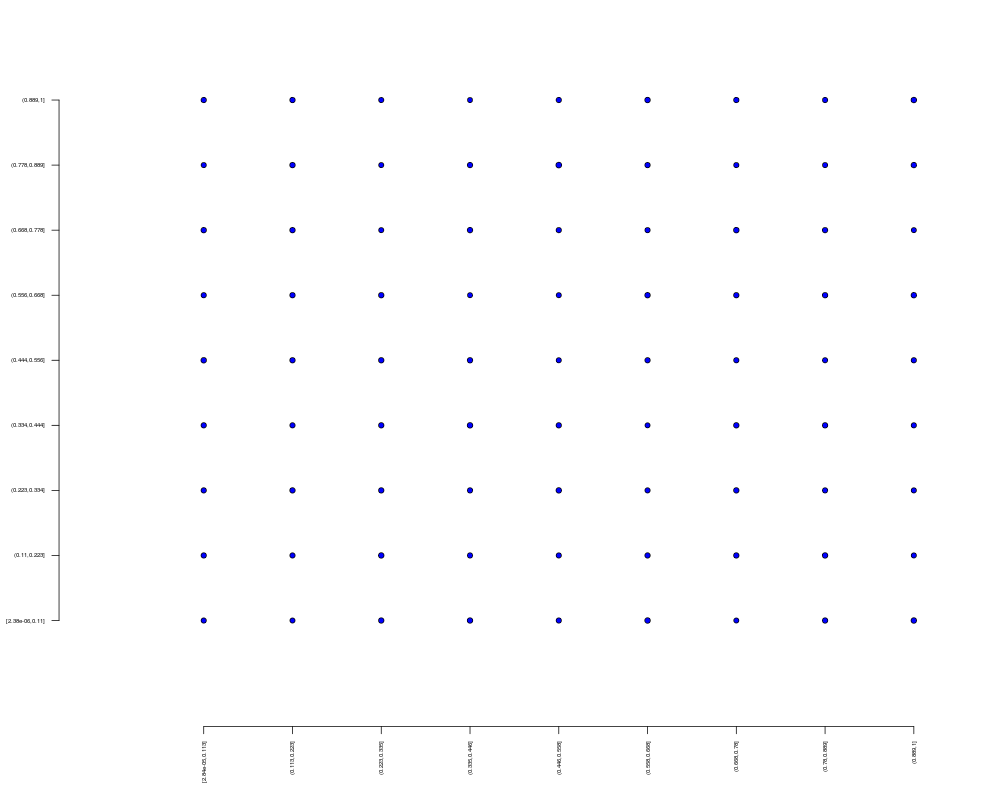
# Example 2
x = runif(100000)
y = runif(100000)
plotBubble(y,x)
Results
R version 3.3.1 (2016-06-21) -- "Bug in Your Hair"
Copyright (C) 2016 The R Foundation for Statistical Computing
Platform: x86_64-pc-linux-gnu (64-bit)

R is free software and comes with ABSOLUTELY NO WARRANTY.
You are welcome to redistribute it under certain conditions.
Type 'license()' or 'licence()' for distribution details.

R is a collaborative project with many contributors.
Type 'contributors()' for more information and
'citation()' on how to cite R or R packages in publications.

Type 'demo()' for some demos, 'help()' for on-line help, or
'help.start()' for an HTML browser interface to help.
Type 'q()' to quit R.

> library(metagenomeSeq)
Loading required package: Biobase
Loading required package: BiocGenerics
Loading required package: parallel

Attaching package: 'BiocGenerics'

The following objects are masked from 'package:parallel':

    clusterApply, clusterApplyLB, clusterCall, clusterEvalQ,
    clusterExport, clusterMap, parApply, parCapply, parLapply,
    parLapplyLB, parRapply, parSapply, parSapplyLB

The following objects are masked from 'package:stats':

    IQR, mad, xtabs

The following objects are masked from 'package:base':

    Filter, Find, Map, Position, Reduce, anyDuplicated, append,
    as.data.frame, cbind, colnames, do.call, duplicated, eval, evalq,
    get, grep, grepl, intersect, is.unsorted, lapply, lengths, mapply,
    match, mget, order, paste, pmax, pmax.int, pmin, pmin.int, rank,
    rbind, rownames, sapply, setdiff, sort, table, tapply, union,
    unique, unsplit

Welcome to Bioconductor

    Vignettes contain introductory material; view with
    'browseVignettes()'. To cite Bioconductor, see
    'citation("Biobase")', and for packages 'citation("pkgname")'.

Loading required package: limma

Attaching package: 'limma'

The following object is masked from 'package:BiocGenerics':

    plotMA

Loading required package: glmnet
Loading required package: Matrix
Loading required package: foreach
Loaded glmnet 2.0-5

Loading required package: RColorBrewer
> png(filename="/home/ddbj/snapshot/RGM3/R_BC/result/metagenomeSeq/plotBubble.Rd_%03d_medium.png", width=480, height=480)
> ### Name: plotBubble
> ### Title: Basic plot of binned vectors.
> ### Aliases: plotBubble
>
> ### ** Examples
>
>
> data(mouseData)
> mouseData = mouseData[which(rowSums(mouseData)>139),]
> sparsity = rowMeans(MRcounts(mouseData)==0)
> lor = log(fitPA(mouseData,cl=pData(mouseData)[,3])$oddsRatio)
> plotBubble(lor,sparsity,main="lor ~ sparsity")
> # Example 2
> x = runif(100000)
> y = runif(100000)
> plotBubble(y,x)
>
>
>
>
>
>
> dev.off()
null device
          1
>
 .
.