Supported by Dr. Osamu Ogasawara and  . . |
|
Last data update: 2014.03.03 |
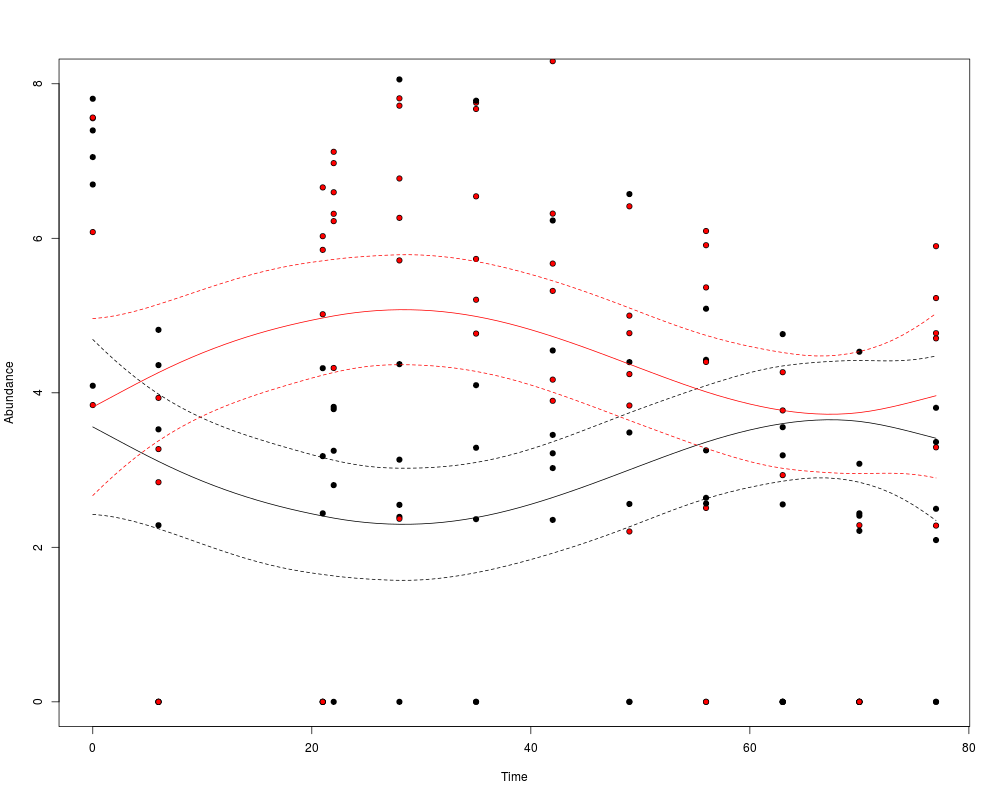
Plot abundances by classDescriptionPlot the abundance of values for each class using a spline approach on the estimated full model. Usage
plotClassTimeSeries(res, formula, xlab = "Time", ylab = "Abundance",
  color0 = "black", color1 = "red", include = c("1", "class",
  "time:class"), ...)
Arguments
ValuePlot for abundances of each class using a spline approach on estimated null model. See Also
Examplesdata(mouseData) res = fitTimeSeries(obj=mouseData,feature="Actinobacteria", class="status",id="mouseID",time="relativeTime",lvl='class',B=10) plotClassTimeSeries(res,pch=21,bg=res$data$class,ylim=c(0,8)) Results
R version 3.3.1 (2016-06-21) -- "Bug in Your Hair"
Copyright (C) 2016 The R Foundation for Statistical Computing
Platform: x86_64-pc-linux-gnu (64-bit)

R is free software and comes with ABSOLUTELY NO WARRANTY.
You are welcome to redistribute it under certain conditions.
Type 'license()' or 'licence()' for distribution details.

R is a collaborative project with many contributors.
Type 'contributors()' for more information and
'citation()' on how to cite R or R packages in publications.

Type 'demo()' for some demos, 'help()' for on-line help, or
'help.start()' for an HTML browser interface to help.
Type 'q()' to quit R.

> library(metagenomeSeq)
Loading required package: Biobase
Loading required package: BiocGenerics
Loading required package: parallel

Attaching package: 'BiocGenerics'

The following objects are masked from 'package:parallel':

    clusterApply, clusterApplyLB, clusterCall, clusterEvalQ,
    clusterExport, clusterMap, parApply, parCapply, parLapply,
    parLapplyLB, parRapply, parSapply, parSapplyLB

The following objects are masked from 'package:stats':

    IQR, mad, xtabs

The following objects are masked from 'package:base':

    Filter, Find, Map, Position, Reduce, anyDuplicated, append,
    as.data.frame, cbind, colnames, do.call, duplicated, eval, evalq,
    get, grep, grepl, intersect, is.unsorted, lapply, lengths, mapply,
    match, mget, order, paste, pmax, pmax.int, pmin, pmin.int, rank,
    rbind, rownames, sapply, setdiff, sort, table, tapply, union,
    unique, unsplit

Welcome to Bioconductor

    Vignettes contain introductory material; view with
    'browseVignettes()'. To cite Bioconductor, see
    'citation("Biobase")', and for packages 'citation("pkgname")'.

Loading required package: limma

Attaching package: 'limma'

The following object is masked from 'package:BiocGenerics':

    plotMA

Loading required package: glmnet
Loading required package: Matrix
Loading required package: foreach
Loaded glmnet 2.0-5

Loading required package: RColorBrewer
> png(filename="/home/ddbj/snapshot/RGM3/R_BC/result/metagenomeSeq/plotClassTimeSeries.Rd_%03d_medium.png", width=480, height=480)
> ### Name: plotClassTimeSeries
> ### Title: Plot abundances by class
> ### Aliases: plotClassTimeSeries
>
> ### ** Examples
>
>
> data(mouseData)
> res = fitTimeSeries(obj=mouseData,feature="Actinobacteria",
+    class="status",id="mouseID",time="relativeTime",lvl='class',B=10)
Loading required namespace: gss
> plotClassTimeSeries(res,pch=21,bg=res$data$class,ylim=c(0,8))
>
>
>
>
>
>
> dev.off()
null device
          1
>
|
Created & Maintained by Osamu Ogasawara (osamu.ogasawara@gmail.com) and 