Supported by Dr. Osamu Ogasawara and  . . |
|
Last data update: 2014.03.03 |
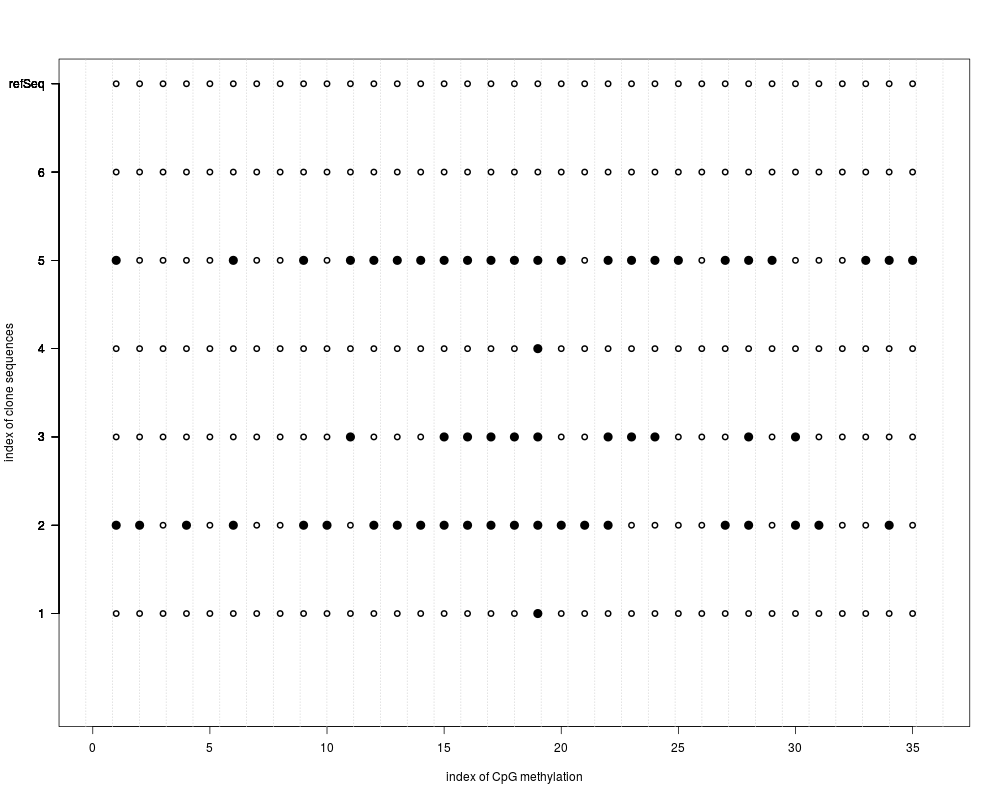
"Lollipops" Methylation plotDescriptionVisualization of methylation patterns in terms of "Lollipops" plot UsageMethLollipops(methData) Arguments
DetailsThe lollipops plot allows the user to study the genomic localization and states of CpG sites. Each circle marks a CpG site under study. Full circles display methylated CpGs and the non filled ones stand for non methylated CpG states. The examined sequences are aligned with respect to the genomic sequence in order to allow for an intuitive visualization of methylation states according to their genomic position. ValueReturns a "lollipop" plot Author(s)Arie Zackay <arie.zackay@mail.huji.ac.il>, Christine Steinhoff <steinhof@molgen.mpg.de> Examples
data("methData")
MethLollipops(methData)
Results
R version 3.3.1 (2016-06-21) -- "Bug in Your Hair"
Copyright (C) 2016 The R Foundation for Statistical Computing
Platform: x86_64-pc-linux-gnu (64-bit)

R is free software and comes with ABSOLUTELY NO WARRANTY.
You are welcome to redistribute it under certain conditions.
Type 'license()' or 'licence()' for distribution details.

R is a collaborative project with many contributors.
Type 'contributors()' for more information and
'citation()' on how to cite R or R packages in publications.

Type 'demo()' for some demos, 'help()' for on-line help, or
'help.start()' for an HTML browser interface to help.
Type 'q()' to quit R.

> library(methVisual)
Loading required package: Biostrings
Loading required package: BiocGenerics
Loading required package: parallel

Attaching package: 'BiocGenerics'

The following objects are masked from 'package:parallel':

    clusterApply, clusterApplyLB, clusterCall, clusterEvalQ,
    clusterExport, clusterMap, parApply, parCapply, parLapply,
    parLapplyLB, parRapply, parSapply, parSapplyLB

The following objects are masked from 'package:stats':

    IQR, mad, xtabs

The following objects are masked from 'package:base':

    Filter, Find, Map, Position, Reduce, anyDuplicated, append,
    as.data.frame, cbind, colnames, do.call, duplicated, eval, evalq,
    get, grep, grepl, intersect, is.unsorted, lapply, lengths, mapply,
    match, mget, order, paste, pmax, pmax.int, pmin, pmin.int, rank,
    rbind, rownames, sapply, setdiff, sort, table, tapply, union,
    unique, unsplit

Loading required package: S4Vectors
Loading required package: stats4

Attaching package: 'S4Vectors'

The following objects are masked from 'package:base':

    colMeans, colSums, expand.grid, rowMeans, rowSums

Loading required package: IRanges
Loading required package: XVector
Loading required package: plotrix
Loading required package: gsubfn
Loading required package: proto
Could not load tcltk.  Will use slower R code instead.
Loading required package: grid
Loading required package: sqldf
Loading required package: RSQLite
Loading required package: DBI
> png(filename="/home/ddbj/snapshot/RGM3/R_BC/result/methVisual/MethLollipops.Rd_%03d_medium.png", width=480, height=480)
> ### Name: MethLollipops
> ### Title: "Lollipops" Methylation plot
> ### Aliases: MethLollipops
> ### Keywords: graphs
>
> ### ** Examples
>
> data("methData")
> MethLollipops(methData)
  LABEL_Y_AXIS       Experiment
1            1   QC_seq_B.fasta
2            2   QC_seq_C.fasta
3            3   QC_seq_E.fasta
4            4   QC_seq_G.fasta
5            5   QC_seq_H.fasta
6            6   QC_seq_I.fasta
7       refSeq refernceSequence
>
>
>
>
>
> dev.off()
null device
          1
>
|
Created & Maintained by Osamu Ogasawara (osamu.ogasawara@gmail.com) and 