Supported by Dr. Osamu Ogasawara and  . . |
|
Last data update: 2014.03.03 |
Fisher exact Test on methylation DataDescriptionFisher exact Test on two subsets of experiments over matched CpG sites UsagemethFisherTest(methData,set1,set2) Arguments
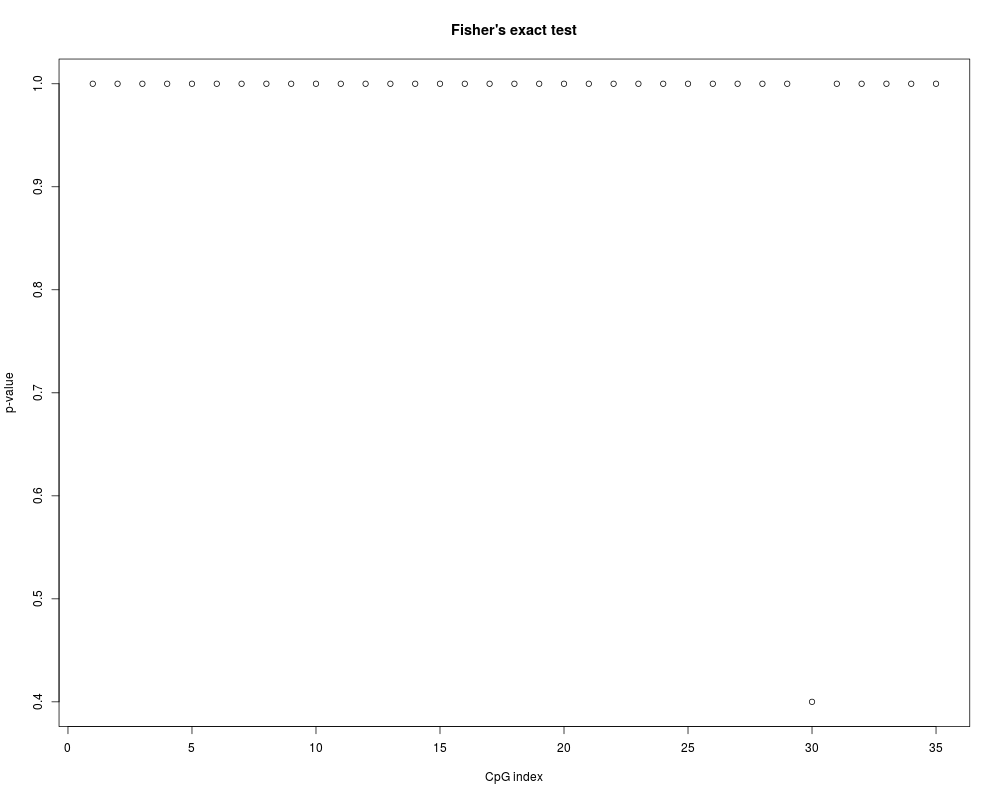
DetailsGiven two clone sequences groups A and B for each CpG site the user can investigate whether there is a difference of methylation status between the two groups at each of the CpG sites. In order to calculate this difference at each CpG site, the two-tailed p-value of Fisher's exact test is calculated from the 2*2 tables at each CpG site. This p-value indicates the level of difference at every single CpG in those two groups of clone sequences. A p-value smaller than 0.05 is an indication for the independence of the methylation state in a certain CpG site when comparing two groups of clone sequences. ValueP- Values vector and a Plot Author(s)Arie Zackay <arie.zackay@mail.huji.ac.il>, Christine Steinhoff <steinhof@molgen.mpg.de> Examplesdata(methData) methFisherTest(methData,c(1,2,3),c(4,5,6)) Results
R version 3.3.1 (2016-06-21) -- "Bug in Your Hair"
Copyright (C) 2016 The R Foundation for Statistical Computing
Platform: x86_64-pc-linux-gnu (64-bit)

R is free software and comes with ABSOLUTELY NO WARRANTY.
You are welcome to redistribute it under certain conditions.
Type 'license()' or 'licence()' for distribution details.

R is a collaborative project with many contributors.
Type 'contributors()' for more information and
'citation()' on how to cite R or R packages in publications.

Type 'demo()' for some demos, 'help()' for on-line help, or
'help.start()' for an HTML browser interface to help.
Type 'q()' to quit R.

> library(methVisual)
Loading required package: Biostrings
Loading required package: BiocGenerics
Loading required package: parallel

Attaching package: 'BiocGenerics'

The following objects are masked from 'package:parallel':

    clusterApply, clusterApplyLB, clusterCall, clusterEvalQ,
    clusterExport, clusterMap, parApply, parCapply, parLapply,
    parLapplyLB, parRapply, parSapply, parSapplyLB

The following objects are masked from 'package:stats':

    IQR, mad, xtabs

The following objects are masked from 'package:base':

    Filter, Find, Map, Position, Reduce, anyDuplicated, append,
    as.data.frame, cbind, colnames, do.call, duplicated, eval, evalq,
    get, grep, grepl, intersect, is.unsorted, lapply, lengths, mapply,
    match, mget, order, paste, pmax, pmax.int, pmin, pmin.int, rank,
    rbind, rownames, sapply, setdiff, sort, table, tapply, union,
    unique, unsplit

Loading required package: S4Vectors
Loading required package: stats4

Attaching package: 'S4Vectors'

The following objects are masked from 'package:base':

    colMeans, colSums, expand.grid, rowMeans, rowSums

Loading required package: IRanges
Loading required package: XVector
Loading required package: plotrix
Loading required package: gsubfn
Loading required package: proto
Could not load tcltk.  Will use slower R code instead.
Loading required package: grid
Loading required package: sqldf
Loading required package: RSQLite
Loading required package: DBI
> png(filename="/home/ddbj/snapshot/RGM3/R_BC/result/methVisual/methFisherTest.Rd_%03d_medium.png", width=480, height=480)
> ### Name: methFisherTest
> ### Title: Fisher exact Test on methylation Data
> ### Aliases: methFisherTest
> ### Keywords: graphs
>
> ### ** Examples
>
> data(methData)
> methFisherTest(methData,c(1,2,3),c(4,5,6))
 [1] 1.0 1.0 1.0 1.0 1.0 1.0 1.0 1.0 1.0 1.0 1.0 1.0 1.0 1.0 1.0 1.0 1.0 1.0 1.0
[20] 1.0 1.0 1.0 1.0 1.0 1.0 1.0 1.0 1.0 1.0 0.4 1.0 1.0 1.0 1.0 1.0
>
>
>
>
>
>
> dev.off()
null device
          1
>
|