Supported by Dr. Osamu Ogasawara and  . . |
|
Last data update: 2014.03.03 |
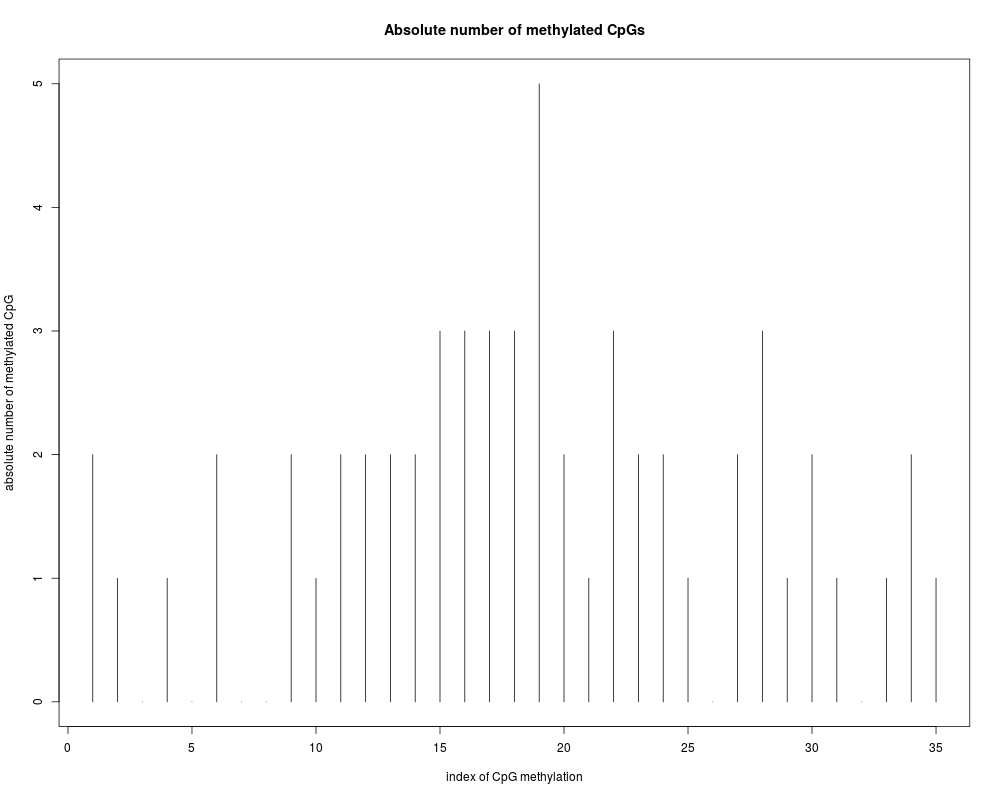
Plot number mathylation on CpGs positionsDescriptionPlot of absolute/relative number of mathylation on aligned CpGs positions UsageplotAbsMethyl(methData,real) Arguments
DetailsThis function generates a plot of the absolute number of methylation in all CpG sites over all examined sequences. It returns a vector with the absolute number of methylation sites of all examined clone sequences. The user supplies a list object containing information about the pairwise alignments, and methylated CpG sites as calculated by MethAlignNW() or makeDataMethGFF(). The user can display the absolute number of methylation over the CpG sites according to their relative position on the reference sequence. ValueA vector with the absolute/relative number of methylation on genomic sequence CpG positions over all examined sequences Author(s)Arie Zackay <arie.zackay@mail.huji.ac.il>, Christine Steinhoff <steinhof@molgen.mpg.de> Examples## using methData data(methData) plotAbsMethyl(methData,real=FALSE) Results
R version 3.3.1 (2016-06-21) -- "Bug in Your Hair"
Copyright (C) 2016 The R Foundation for Statistical Computing
Platform: x86_64-pc-linux-gnu (64-bit)

R is free software and comes with ABSOLUTELY NO WARRANTY.
You are welcome to redistribute it under certain conditions.
Type 'license()' or 'licence()' for distribution details.

R is a collaborative project with many contributors.
Type 'contributors()' for more information and
'citation()' on how to cite R or R packages in publications.

Type 'demo()' for some demos, 'help()' for on-line help, or
'help.start()' for an HTML browser interface to help.
Type 'q()' to quit R.

> library(methVisual)
Loading required package: Biostrings
Loading required package: BiocGenerics
Loading required package: parallel

Attaching package: 'BiocGenerics'

The following objects are masked from 'package:parallel':

    clusterApply, clusterApplyLB, clusterCall, clusterEvalQ,
    clusterExport, clusterMap, parApply, parCapply, parLapply,
    parLapplyLB, parRapply, parSapply, parSapplyLB

The following objects are masked from 'package:stats':

    IQR, mad, xtabs

The following objects are masked from 'package:base':

    Filter, Find, Map, Position, Reduce, anyDuplicated, append,
    as.data.frame, cbind, colnames, do.call, duplicated, eval, evalq,
    get, grep, grepl, intersect, is.unsorted, lapply, lengths, mapply,
    match, mget, order, paste, pmax, pmax.int, pmin, pmin.int, rank,
    rbind, rownames, sapply, setdiff, sort, table, tapply, union,
    unique, unsplit

Loading required package: S4Vectors
Loading required package: stats4

Attaching package: 'S4Vectors'

The following objects are masked from 'package:base':

    colMeans, colSums, expand.grid, rowMeans, rowSums

Loading required package: IRanges
Loading required package: XVector
Loading required package: plotrix
Loading required package: gsubfn
Loading required package: proto
Could not load tcltk.  Will use slower R code instead.
Loading required package: grid
Loading required package: sqldf
Loading required package: RSQLite
Loading required package: DBI
> png(filename="/home/ddbj/snapshot/RGM3/R_BC/result/methVisual/plotAbsMethyl.Rd_%03d_medium.png", width=480, height=480)
> ### Name: plotAbsMethyl
> ### Title: Plot number mathylation on CpGs positions
> ### Aliases: plotAbsMethyl
> ### Keywords: graphs
>
> ### ** Examples
>
> ## using methData
> data(methData)
> plotAbsMethyl(methData,real=FALSE)
 [1] 2 1 0 1 0 2 0 0 2 1 2 2 2 2 3 3 3 3 5 2 1 3 2 2 1 0 2 3 1 2 1 0 1 2 1
>
>
>
>
>
> dev.off()
null device
          1
>
|