Supported by Dr. Osamu Ogasawara and  . . |
|
Last data update: 2014.03.03 |
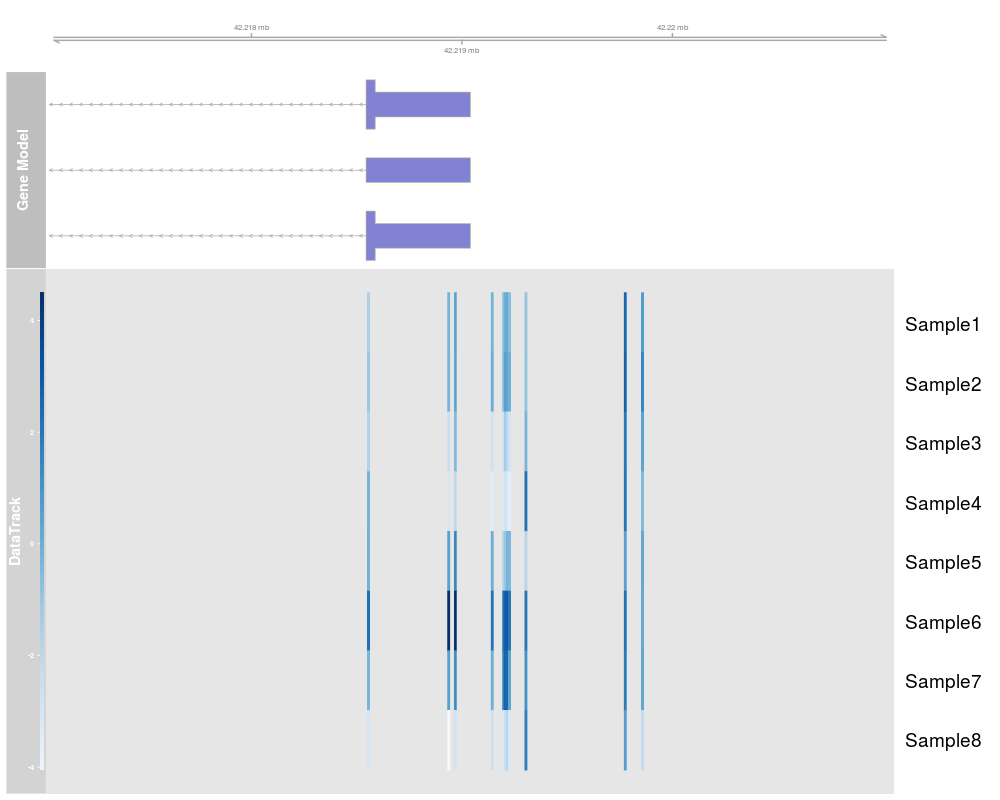
plot Tracks with additional DataTrack information added to the left of the plotDescriptionplot Tracks with additional DataTrack information added to the left of the plot Usage
plotTracksWithDataTrackInfo(trackList, labels = NULL, grange2show = NULL, dataTrackName = NULL, dataInfo = NULL, dataColorMap = NULL,
	dataInfoRange = NULL, dataBackground = gray(0.9), minHeatmapColumnWidth = 2, labelWidth = 0.1,
	gradient = c("blue", "white", "red"), ncolor = 16, main = "", newPlot = FALSE, sizes = NULL, ...)
Arguments
DetailsThis function is adapted based on the ValueGrid viewport layout information Author(s)Pan Du See AlsoSee Also Examples
	data(exampleMethyGenoSet)
	if (require(TxDb.Hsapiens.UCSC.hg19.knownGene) && require(Gviz)) {
		## define data track
		exampleMethyGenoSet <- checkChrName(exampleMethyGenoSet)
		dTrack <- DataTrack(range=suppressWarnings(as(rowRanges(exampleMethyGenoSet), 'GRanges')), data=t(exprs(exampleMethyGenoSet)),
			chromosome='chr21', type='heatmap')

		## build annotation tracks
		annotationTracks <- buildAnnotationTracks('1826', includeGeneBody = FALSE, genomicFeature = "TxDb.Hsapiens.UCSC.hg19.knownGene", cytobandInfo=NA, CpGInfo=NA)
		trackList <- c(annotationTracks, list(dTrack))
		plotTracksWithDataTrackInfo(trackList, labels=colnames(exampleMethyGenoSet), grange2show = attr(annotationTracks, 'grange2show'))
	}
Results
R version 3.3.1 (2016-06-21) -- "Bug in Your Hair"
Copyright (C) 2016 The R Foundation for Statistical Computing
Platform: x86_64-pc-linux-gnu (64-bit)

R is free software and comes with ABSOLUTELY NO WARRANTY.
You are welcome to redistribute it under certain conditions.
Type 'license()' or 'licence()' for distribution details.

R is a collaborative project with many contributors.
Type 'contributors()' for more information and
'citation()' on how to cite R or R packages in publications.

Type 'demo()' for some demos, 'help()' for on-line help, or
'help.start()' for an HTML browser interface to help.
Type 'q()' to quit R.

> library(methyAnalysis)
Loading required package: grid
Loading required package: BiocGenerics
Loading required package: parallel

Attaching package: 'BiocGenerics'

The following objects are masked from 'package:parallel':

    clusterApply, clusterApplyLB, clusterCall, clusterEvalQ,
    clusterExport, clusterMap, parApply, parCapply, parLapply,
    parLapplyLB, parRapply, parSapply, parSapplyLB

The following objects are masked from 'package:stats':

    IQR, mad, xtabs

The following objects are masked from 'package:base':

    Filter, Find, Map, Position, Reduce, anyDuplicated, append,
    as.data.frame, cbind, colnames, do.call, duplicated, eval, evalq,
    get, grep, grepl, intersect, is.unsorted, lapply, lengths, mapply,
    match, mget, order, paste, pmax, pmax.int, pmin, pmin.int, rank,
    rbind, rownames, sapply, setdiff, sort, table, tapply, union,
    unique, unsplit

Loading required package: IRanges
Loading required package: S4Vectors
Loading required package: stats4

Attaching package: 'S4Vectors'

The following objects are masked from 'package:base':

    colMeans, colSums, expand.grid, rowMeans, rowSums

Loading required package: GenomeInfoDb
Loading required package: GenomicRanges
Loading required package: Biobase
Welcome to Bioconductor

    Vignettes contain introductory material; view with
    'browseVignettes()'. To cite Bioconductor, see
    'citation("Biobase")', and for packages 'citation("pkgname")'.

Loading required package: org.Hs.eg.db
Loading required package: AnnotationDbi

Setting options('download.file.method.GEOquery'='auto')
Setting options('GEOquery.inmemory.gpl'=FALSE)
No methods found in "GenomicRanges" for requests: overlapsAny
No methods found in "genoset" for requests: rowRanges, rowRanges<-, toGenomeOrder
Warning messages:
1: multiple methods tables found for 'colMeans'
2: multiple methods tables found for 'colSums'
3: multiple methods tables found for 'rowMeans'
4: multiple methods tables found for 'rowSums'
> png(filename="/home/ddbj/snapshot/RGM3/R_BC/result/methyAnalysis/plotTracksWithDataTrackInfo.Rd_%03d_medium.png", width=480, height=480)
> ### Name: plotTracksWithDataTrackInfo
> ### Title: plot Tracks with additional DataTrack information added to the
> ###   left of the plot
> ### Aliases: plotTracksWithDataTrackInfo
> ### Keywords: methods hplot
>
> ### ** Examples
>
>
> 	data(exampleMethyGenoSet)
> 	if (require(TxDb.Hsapiens.UCSC.hg19.knownGene) && require(Gviz)) {
+ 		## define data track
+ 		exampleMethyGenoSet <- checkChrName(exampleMethyGenoSet)
+ 		dTrack <- DataTrack(range=suppressWarnings(as(rowRanges(exampleMethyGenoSet), 'GRanges')), data=t(exprs(exampleMethyGenoSet)),
+ 			chromosome='chr21', type='heatmap')
+
+ 		## build annotation tracks
+ 		annotationTracks <- buildAnnotationTracks('1826', includeGeneBody = FALSE, genomicFeature = "TxDb.Hsapiens.UCSC.hg19.knownGene", cytobandInfo=NA, CpGInfo=NA)
+ 		trackList <- c(annotationTracks, list(dTrack))
+ 		plotTracksWithDataTrackInfo(trackList, labels=colnames(exampleMethyGenoSet), grange2show = attr(annotationTracks, 'grange2show'))
+ 	}
Loading required package: TxDb.Hsapiens.UCSC.hg19.knownGene
Loading required package: GenomicFeatures
Loading required package: Gviz
>
>
>
>
>
>
> dev.off()
null device
          1
>
|