Supported by Dr. Osamu Ogasawara and  . . |
|
Last data update: 2014.03.03 |
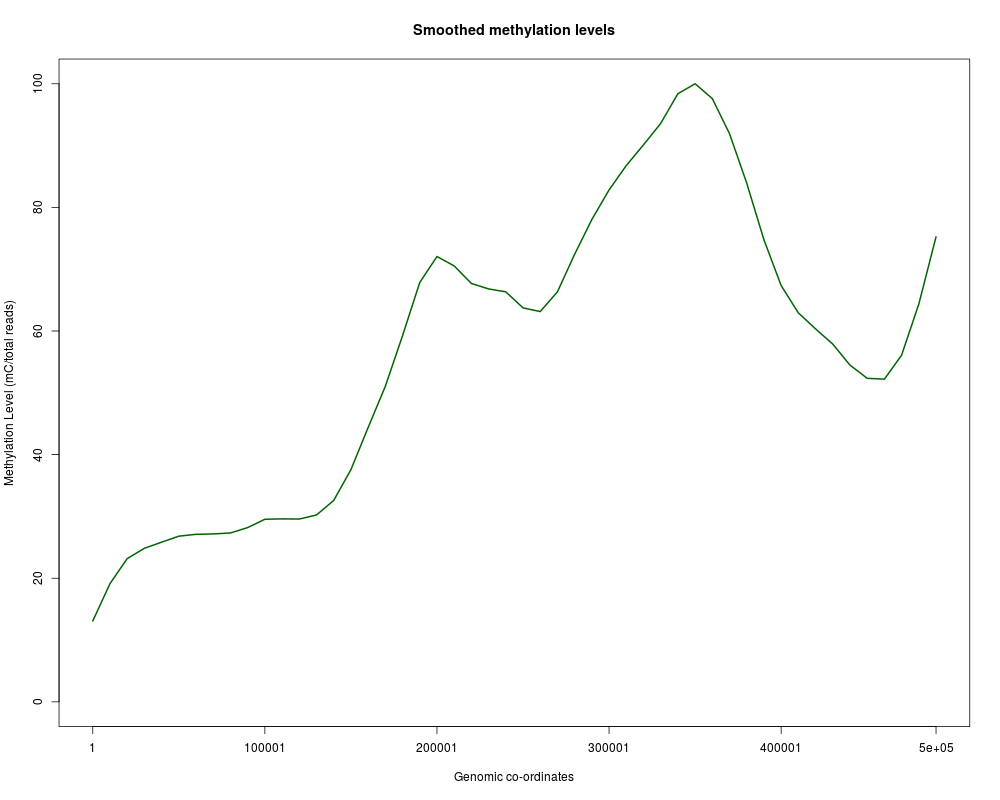
Smoothing and plotting methylation dataDescriptionSmoothing and plotting methylation data, even chromosome wide. Usage## S4 method for signature 'methylPipe,BSdata' mCsmoothing(Object, refgr, Scorefun='sum', Nbins=20, Context="CG", plot=TRUE) Arguments
DetailsThe sum or the mean methylation level is determined on each window of size Binsize and smoothed with the smooth.spline function. ValueA list with three components: pos (the left most point of each window), score (either the sum or the mean methylation levels), smoothed (the smoothed methylation levels). Author(s)Mattia Pelizzola Examples
require(BSgenome.Hsapiens.UCSC.hg18)
uncov_GR <- GRanges(Rle('chr20'), IRanges(c(14350,69251,84185), c(18349,73250,88184)))
H1data <- system.file('extdata', 'H1_chr20_CG_10k_tabix_out.txt.gz', package='methylPipe')
H1.db <- BSdata(file=H1data, uncov=uncov_GR, org=Hsapiens)
gr <- GRanges("chr20",IRanges(1,5e5))
sres <- mCsmoothing(H1.db, gr, Scorefun='sum', Nbins=50, Context="CG", plot=TRUE)
Results
R version 3.3.1 (2016-06-21) -- "Bug in Your Hair"
Copyright (C) 2016 The R Foundation for Statistical Computing
Platform: x86_64-pc-linux-gnu (64-bit)

R is free software and comes with ABSOLUTELY NO WARRANTY.
You are welcome to redistribute it under certain conditions.
Type 'license()' or 'licence()' for distribution details.

R is a collaborative project with many contributors.
Type 'contributors()' for more information and
'citation()' on how to cite R or R packages in publications.

Type 'demo()' for some demos, 'help()' for on-line help, or
'help.start()' for an HTML browser interface to help.
Type 'q()' to quit R.

> library(methylPipe)
Loading required package: GenomicRanges
Loading required package: BiocGenerics
Loading required package: parallel

Attaching package: 'BiocGenerics'

The following objects are masked from 'package:parallel':

    clusterApply, clusterApplyLB, clusterCall, clusterEvalQ,
    clusterExport, clusterMap, parApply, parCapply, parLapply,
    parLapplyLB, parRapply, parSapply, parSapplyLB

The following objects are masked from 'package:stats':

    IQR, mad, xtabs

The following objects are masked from 'package:base':

    Filter, Find, Map, Position, Reduce, anyDuplicated, append,
    as.data.frame, cbind, colnames, do.call, duplicated, eval, evalq,
    get, grep, grepl, intersect, is.unsorted, lapply, lengths, mapply,
    match, mget, order, paste, pmax, pmax.int, pmin, pmin.int, rank,
    rbind, rownames, sapply, setdiff, sort, table, tapply, union,
    unique, unsplit

Loading required package: S4Vectors
Loading required package: stats4

Attaching package: 'S4Vectors'

The following objects are masked from 'package:base':

    colMeans, colSums, expand.grid, rowMeans, rowSums

Loading required package: IRanges
Loading required package: GenomeInfoDb
Loading required package: SummarizedExperiment
Loading required package: Biobase
Welcome to Bioconductor

    Vignettes contain introductory material; view with
    'browseVignettes()'. To cite Bioconductor, see
    'citation("Biobase")', and for packages 'citation("pkgname")'.

Loading required package: Rsamtools
Loading required package: Biostrings
Loading required package: XVector
> png(filename="/home/ddbj/snapshot/RGM3/R_BC/result/methylPipe/mCsmoothing.Rd_%03d_medium.png", width=480, height=480)
> ### Name: mCsmoothing
> ### Title: Smoothing and plotting methylation data
> ### Aliases: mCsmoothing mCsmoothing,methylPipe,BSdata
> ###   mCsmoothing,methylPipe,BSdata-method mCsmoothing-methods
> ###   mCsmoothing,BSdata-method
>
> ### ** Examples
>
> require(BSgenome.Hsapiens.UCSC.hg18)
Loading required package: BSgenome.Hsapiens.UCSC.hg18
Loading required package: BSgenome
Loading required package: rtracklayer
> uncov_GR <- GRanges(Rle('chr20'), IRanges(c(14350,69251,84185), c(18349,73250,88184)))
> H1data <- system.file('extdata', 'H1_chr20_CG_10k_tabix_out.txt.gz', package='methylPipe')
> H1.db <- BSdata(file=H1data, uncov=uncov_GR, org=Hsapiens)
> gr <- GRanges("chr20",IRanges(1,5e5))
> sres <- mCsmoothing(H1.db, gr, Scorefun='sum', Nbins=50, Context="CG", plot=TRUE)
>
>
>
>
>
> dev.off()
null device
          1
>
|
Created & Maintained by Osamu Ogasawara (osamu.ogasawara@gmail.com) and 