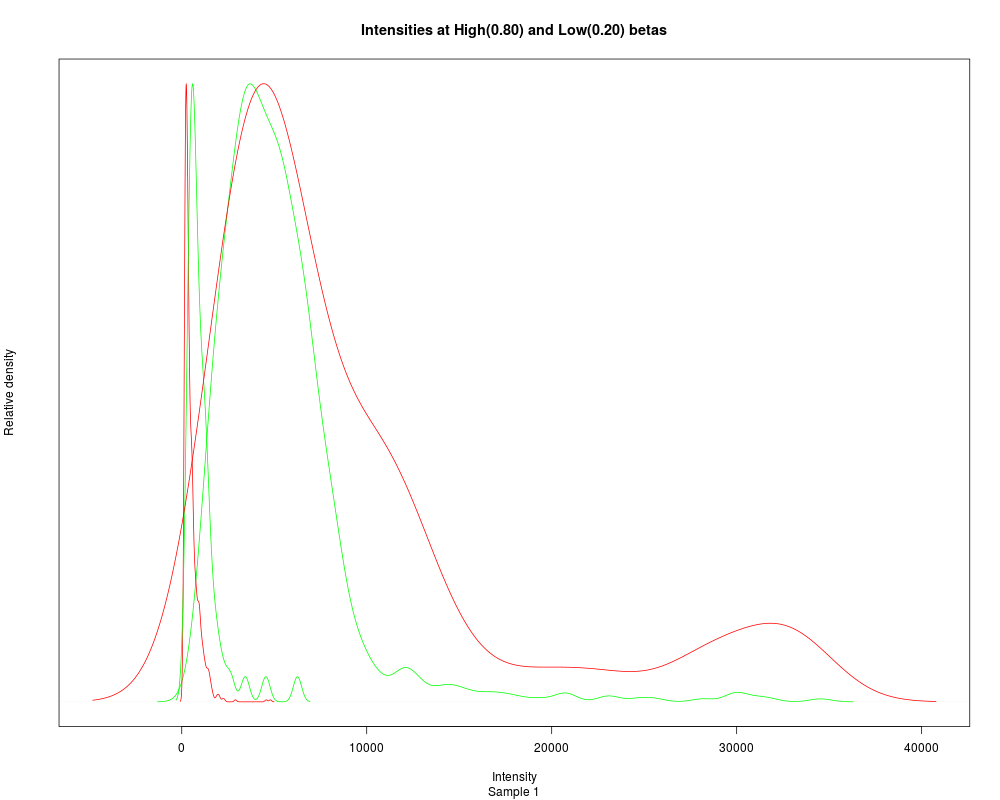
The Illumina methylation platforms all show a significant dye bias. The
plotSampleIntensities method shows the density plots for the two channels
allowing direct visualization of the effect.
Usage
plotSampleIntensities(x,beta.cuts,s)
Arguments
x
an object of class MethyLumi or a subclass
beta.cuts
cutoffs for low and high beta values
s
sample number to plot
Examples
data(mldat)
plotSampleIntensities(mldat,s=1)
Results
R version 3.3.1 (2016-06-21) -- "Bug in Your Hair"
Copyright (C) 2016 The R Foundation for Statistical Computing
Platform: x86_64-pc-linux-gnu (64-bit)

R is free software and comes with ABSOLUTELY NO WARRANTY.
You are welcome to redistribute it under certain conditions.
Type 'license()' or 'licence()' for distribution details.

R is a collaborative project with many contributors.
Type 'contributors()' for more information and
'citation()' on how to cite R or R packages in publications.

Type 'demo()' for some demos, 'help()' for on-line help, or
'help.start()' for an HTML browser interface to help.
Type 'q()' to quit R.

> library(methylumi)
Loading required package: Biobase
Loading required package: BiocGenerics
Loading required package: parallel

Attaching package: 'BiocGenerics'

The following objects are masked from 'package:parallel':

    clusterApply, clusterApplyLB, clusterCall, clusterEvalQ,
    clusterExport, clusterMap, parApply, parCapply, parLapply,
    parLapplyLB, parRapply, parSapply, parSapplyLB

The following objects are masked from 'package:stats':

    IQR, mad, xtabs

The following objects are masked from 'package:base':

    Filter, Find, Map, Position, Reduce, anyDuplicated, append,
    as.data.frame, cbind, colnames, do.call, duplicated, eval, evalq,
    get, grep, grepl, intersect, is.unsorted, lapply, lengths, mapply,
    match, mget, order, paste, pmax, pmax.int, pmin, pmin.int, rank,
    rbind, rownames, sapply, setdiff, sort, table, tapply, union,
    unique, unsplit

Welcome to Bioconductor

    Vignettes contain introductory material; view with
    'browseVignettes()'. To cite Bioconductor, see
    'citation("Biobase")', and for packages 'citation("pkgname")'.

Loading required package: scales
Loading required package: reshape2
Loading required package: ggplot2
Loading required package: matrixStats
matrixStats v0.50.2 (2016-04-24) successfully loaded. See ?matrixStats for help.

Attaching package: 'matrixStats'

The following objects are masked from 'package:Biobase':

    anyMissing, rowMedians

Loading required package: FDb.InfiniumMethylation.hg19
Loading required package: GenomicFeatures
Loading required package: S4Vectors
Loading required package: stats4

Attaching package: 'S4Vectors'

The following objects are masked from 'package:base':

    colMeans, colSums, expand.grid, rowMeans, rowSums

Loading required package: IRanges
Loading required package: GenomeInfoDb
Loading required package: GenomicRanges
Loading required package: AnnotationDbi
Loading required package: TxDb.Hsapiens.UCSC.hg19.knownGene
Loading required package: org.Hs.eg.db

Loading required package: minfi
Loading required package: lattice
Loading required package: SummarizedExperiment

Attaching package: 'SummarizedExperiment'

The following object is masked from 'package:matrixStats':

    rowRanges

Loading required package: Biostrings
Loading required package: XVector
Loading required package: bumphunter
Loading required package: foreach
Loading required package: iterators
Loading required package: locfit
locfit 1.5-9.1 	 2013-03-22
Setting options('download.file.method.GEOquery'='auto')
Setting options('GEOquery.inmemory.gpl'=FALSE)
> png(filename="/home/ddbj/snapshot/RGM3/R_BC/result/methylumi/plotSampleIntensities.Rd_%03d_medium.png", width=480, height=480)
> ### Name: plotSampleIntensities
> ### Title: Plot the sample intensities.
> ### Aliases: plotSampleIntensities
> ### Keywords: hplot
>
> ### ** Examples
>
> data(mldat)
> plotSampleIntensities(mldat,s=1)
The purpose of this method is better served by diagnostics()
>
>
>
>
>
> dev.off()
null device
          1
>
 .
.