Supported by Dr. Osamu Ogasawara and  . . |
|
Last data update: 2014.03.03 |
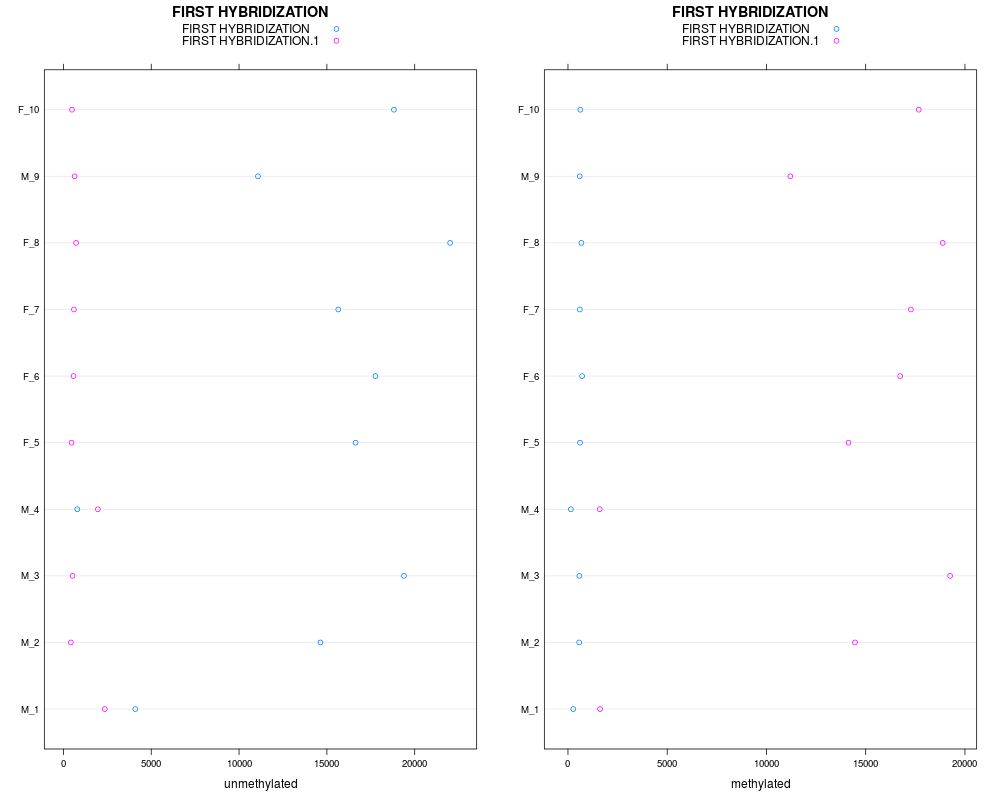
Methods for dealing with control data for Illumina methylation data.DescriptionThe Usageqcplot(object,controltype,...) controlTypes(object,...) Arguments
DetailsThe descriptions of the various control types can be obtained from the Illumina methylation user's guides. Author(s)Sean Davis <sdavis2@mail.nih.gov> See Also
Examplesdata(mldat) controlTypes(mldat) qcplot(mldat,controlTypes(mldat)[3]) Results
R version 3.3.1 (2016-06-21) -- "Bug in Your Hair"
Copyright (C) 2016 The R Foundation for Statistical Computing
Platform: x86_64-pc-linux-gnu (64-bit)

R is free software and comes with ABSOLUTELY NO WARRANTY.
You are welcome to redistribute it under certain conditions.
Type 'license()' or 'licence()' for distribution details.

R is a collaborative project with many contributors.
Type 'contributors()' for more information and
'citation()' on how to cite R or R packages in publications.

Type 'demo()' for some demos, 'help()' for on-line help, or
'help.start()' for an HTML browser interface to help.
Type 'q()' to quit R.

> library(methylumi)
Loading required package: Biobase
Loading required package: BiocGenerics
Loading required package: parallel

Attaching package: 'BiocGenerics'

The following objects are masked from 'package:parallel':

    clusterApply, clusterApplyLB, clusterCall, clusterEvalQ,
    clusterExport, clusterMap, parApply, parCapply, parLapply,
    parLapplyLB, parRapply, parSapply, parSapplyLB

The following objects are masked from 'package:stats':

    IQR, mad, xtabs

The following objects are masked from 'package:base':

    Filter, Find, Map, Position, Reduce, anyDuplicated, append,
    as.data.frame, cbind, colnames, do.call, duplicated, eval, evalq,
    get, grep, grepl, intersect, is.unsorted, lapply, lengths, mapply,
    match, mget, order, paste, pmax, pmax.int, pmin, pmin.int, rank,
    rbind, rownames, sapply, setdiff, sort, table, tapply, union,
    unique, unsplit

Welcome to Bioconductor

    Vignettes contain introductory material; view with
    'browseVignettes()'. To cite Bioconductor, see
    'citation("Biobase")', and for packages 'citation("pkgname")'.

Loading required package: scales
Loading required package: reshape2
Loading required package: ggplot2
Loading required package: matrixStats
matrixStats v0.50.2 (2016-04-24) successfully loaded. See ?matrixStats for help.

Attaching package: 'matrixStats'

The following objects are masked from 'package:Biobase':

    anyMissing, rowMedians

Loading required package: FDb.InfiniumMethylation.hg19
Loading required package: GenomicFeatures
Loading required package: S4Vectors
Loading required package: stats4

Attaching package: 'S4Vectors'

The following objects are masked from 'package:base':

    colMeans, colSums, expand.grid, rowMeans, rowSums

Loading required package: IRanges
Loading required package: GenomeInfoDb
Loading required package: GenomicRanges
Loading required package: AnnotationDbi
Loading required package: TxDb.Hsapiens.UCSC.hg19.knownGene
Loading required package: org.Hs.eg.db

Loading required package: minfi
Loading required package: lattice
Loading required package: SummarizedExperiment

Attaching package: 'SummarizedExperiment'

The following object is masked from 'package:matrixStats':

    rowRanges

Loading required package: Biostrings
Loading required package: XVector
Loading required package: bumphunter
Loading required package: foreach
Loading required package: iterators
Loading required package: locfit
locfit 1.5-9.1 	 2013-03-22
Setting options('download.file.method.GEOquery'='auto')
Setting options('GEOquery.inmemory.gpl'=FALSE)
> png(filename="/home/ddbj/snapshot/RGM3/R_BC/result/methylumi/qcplot.Rd_%03d_medium.png", width=480, height=480)
> ### Name: qcplot
> ### Title: Methods for dealing with control data for Illumina methylation
> ###   data.
> ### Aliases: qcplot controlTypes
> ### Keywords: hplot
>
> ### ** Examples
>
> data(mldat)
> controlTypes(mldat)
[1] "ALLELE SPECIFIC EXTENSION" "EXTENSION GAP"
[3] "FIRST HYBRIDIZATION"       "GENDER"
[5] "NEGATIVE"                  "PCR CONTAMINATION"
[7] "SECOND HYBRIDIZATION"
> qcplot(mldat,controlTypes(mldat)[3])
>
>
>
>
>
> dev.off()
null device
          1
>
|
Created & Maintained by Osamu Ogasawara (osamu.ogasawara@gmail.com) and 