Supported by Dr. Osamu Ogasawara and  . . |
|
Last data update: 2014.03.03 |
Create miRNA Enrichment Summary Table as data.frameDescriptionThis function takes an miRNApath object which has been evaluated by runEnrichment(), and provides a data.frame summary. Usage
mirnaTable(mirnaobj, groups=NULL, format="Tall",
   Significance=0.2, na.char=NA, pvalueTypes=c("pvalues",
   "permpvalues"), maxStringLength=NA)
Arguments
DetailsThis function simply combines the various results from the runEnrichment method into one data.frame suitable for plotting or printing in a table. Due to potentially large data volume, the subset feature even when used liberally can substantially reduce the returned dataset size. The Valuedata.frame For Tall data, the columns contain P-values and other values useful for discriminating potential hits, the rows contain each miRNA-group combination tested which meets the P-value cutoff. The miRNAs and genes contributing to the enrichment results are concatenated to be summarized in one row and can be rather large. For SuperTall data, the Tall table as described above is returned, except that the concatenated miRNA-gene values are separated to one row each. Every individual miRNA and gene value is represented on its own row, which can facilitate some summary views or data filtering techniques (e.g. Excel or Spotfire.) For Wide data, the columns contain the group names, the rows contain the pathway name, and the cells contain the P-value. Note that the column names will have the P-value column header prepended to the column name, e.g. "pvalue.GroupName". An important note when supplying string na.char values, be sure to convert the data to a numeric matrix before calling functions such as heatmap, taking care to remove string values or convert strings to 1.0 beforehand. Author(s)James M. Ward jmw86069@gmail.com ReferencesJohn Cogswell (2008) Identification of miRNA changes in Alzheimer's disease brain and CSF yields putative biomarkers and insights into disease pathways, Journal of Alzheimer's Disease 14, 27-41. See Also
Examples
## Start with miRNA data from this package
data(mirnaobj);
## Now run enrichment test
mirnaobj <- runEnrichment( mirnaobj=mirnaobj, Composite=TRUE,
groups=NULL, permutations=0 );
## Print out a summary table of significant results
finaltable <- mirnaTable( mirnaobj, groups=NULL, format="Tall",
Significance=0.1, pvalueTypes=c("pvalues") );
finaltable[1:20,];
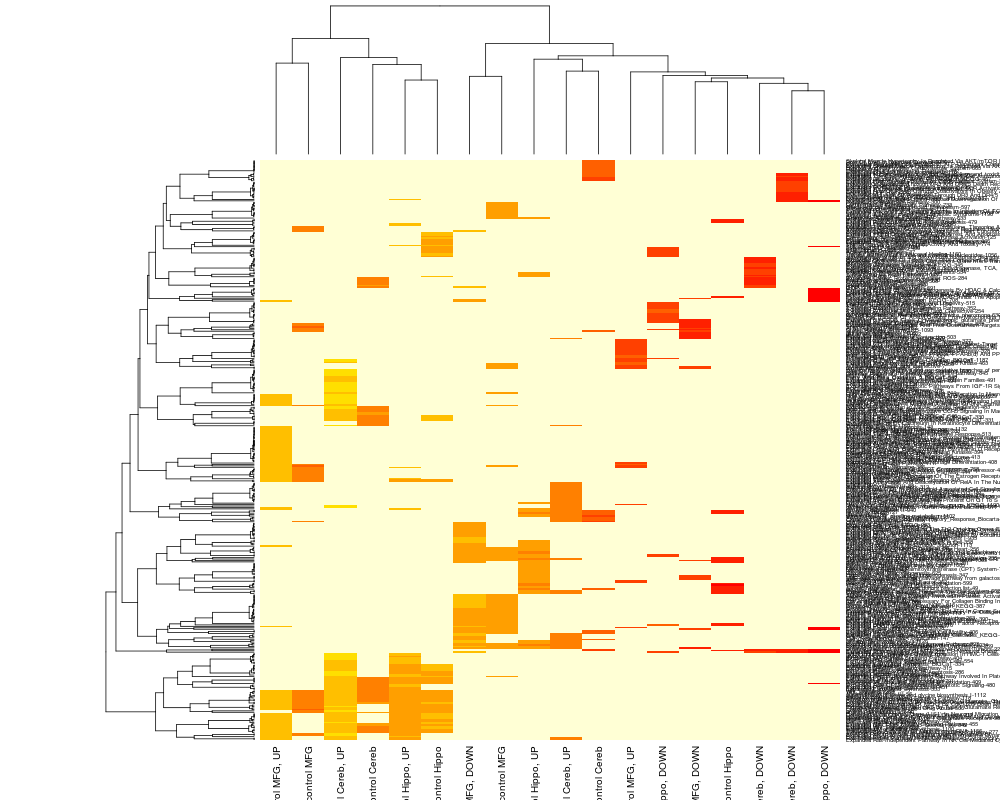
## Example which calls heatmap function on the resulting data
widetable <- mirnaTable( mirnaobj, groups=NULL, format="Wide",
Significance=0.1, na.char=NA, pvalueTypes=c("pvalues") );
## Assign 1 to NA values, assuming they're all equally
## non-significant
widetable[is.na(widetable)] <- 1;
## Display a heatmap of the result across sample groups
pathwaycol <- mirnaobj@columns["pathwaycol"];
pathwayidcol <- mirnaobj@columns["pathwayidcol"];
rownames(widetable) <- apply(widetable[,c(pathwaycol,
pathwayidcol)], 1, function(i)paste(i, collapse="-"));
wt <- as.matrix(widetable[3:dim(widetable)[2]], mode="numeric")
heatmap(wt, scale="col");
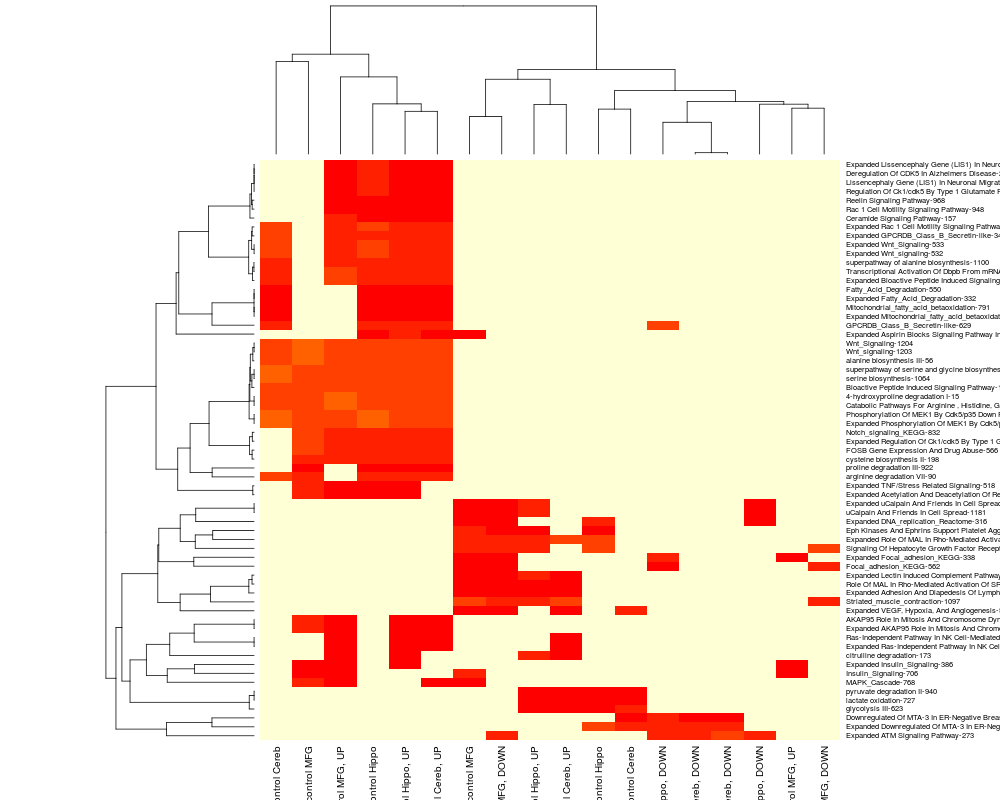
## Show results where pathways are shared in four or more
## sample groups
pathwaySubset <- apply(wt, 1, function(i)
{
length(i[i < 1]) >= 4;
} )
heatmap(wt[pathwaySubset,], scale="row");
Results
R version 3.3.1 (2016-06-21) -- "Bug in Your Hair"
Copyright (C) 2016 The R Foundation for Statistical Computing
Platform: x86_64-pc-linux-gnu (64-bit)

R is free software and comes with ABSOLUTELY NO WARRANTY.
You are welcome to redistribute it under certain conditions.
Type 'license()' or 'licence()' for distribution details.

R is a collaborative project with many contributors.
Type 'contributors()' for more information and
'citation()' on how to cite R or R packages in publications.

Type 'demo()' for some demos, 'help()' for on-line help, or
'help.start()' for an HTML browser interface to help.
Type 'q()' to quit R.

> library(miRNApath)
> png(filename="/home/ddbj/snapshot/RGM3/R_BC/result/miRNApath/mirnaTable.Rd_%03d_medium.png", width=480, height=480)
> ### Name: mirnaTable
> ### Title: Create miRNA Enrichment Summary Table as data.frame
> ### Aliases: mirnaTable
> ### Keywords: manip
>
> ### ** Examples
>
> ## Start with miRNA data from this package
> data(mirnaobj);
>
> ## Now run enrichment test
> mirnaobj <- runEnrichment( mirnaobj=mirnaobj, Composite=TRUE,
+    groups=NULL, permutations=0 );
>
> ## Print out a summary table of significant results
> finaltable <- mirnaTable( mirnaobj, groups=NULL, format="Tall",
+     Significance=0.1, pvalueTypes=c("pvalues") );
> finaltable[1:20,];
          pvalues Measured pathway mirnaGenes Enriched pathway mirnaGenes
409  9.947322e-05                          24                          21
791  9.947322e-05                          24                          21
332  1.504163e-04                          20                          18
550  1.504163e-04                          20                          18
440  3.029464e-03                          15                          13
1100 6.927916e-03                           7                           7
1156 6.927916e-03                           7                           7
277  1.282921e-02                          18                          14
333  1.669057e-02                          12                          10
552  1.669057e-02                          12                          10
118  1.725647e-02                           9                           8
331  2.477242e-02                          29                          20
549  2.477242e-02                          29                          20
130  2.870345e-02                           5                           5
284  2.870345e-02                           5                           5
56   2.870345e-02                           5                           5
568  2.870345e-02                           5                           5
659  2.870345e-02                           5                           5
330  3.105859e-02                          26                          18
546  3.105859e-02                          26                          18
     Genes Enriched miRNAs Enriched Total mirnaGenes Total filtered mirnaGenes
409               8              13             6231                      3064
791               8              13             6231                      3064
332               6              10             6231                      3064
550               6              10             6231                      3064
440               6              12             6231                      3064
1100              3               4             6231                      3064
1156              2               4             6231                      3064
277               8              10             6231                      3064
333               5               7             6231                      3064
552               5               7             6231                      3064
118               4               5             6231                      3064
331               8              17             6231                      3064
549               8              17             6231                      3064
130               1               5             6231                      3064
284               1               5             6231                      3064
56                1               2             6231                      3064
568               1               5             6231                      3064
659               4               5             6231                      3064
330               7              15             6231                      3064
546               7              15             6231                      3064
                         Group PATHWAY_ID
409  AD Cereb vs control Cereb        409
791  AD Cereb vs control Cereb        791
332  AD Cereb vs control Cereb        332
550  AD Cereb vs control Cereb        550
440  AD Cereb vs control Cereb        440
1100 AD Cereb vs control Cereb       1100
1156 AD Cereb vs control Cereb       1156
277  AD Cereb vs control Cereb        277
333  AD Cereb vs control Cereb        333
552  AD Cereb vs control Cereb        552
118  AD Cereb vs control Cereb        118
331  AD Cereb vs control Cereb        331
549  AD Cereb vs control Cereb        549
130  AD Cereb vs control Cereb        130
284  AD Cereb vs control Cereb        284
56   AD Cereb vs control Cereb         56
568  AD Cereb vs control Cereb        568
659  AD Cereb vs control Cereb        659
330  AD Cereb vs control Cereb        330
546  AD Cereb vs control Cereb        546
                                                          Pathway Name
409                    Expanded Mitochondrial_fatty_acid_betaoxidation
791                             Mitochondrial_fatty_acid_betaoxidation
332                                    Expanded Fatty_Acid_Degradation
550                                             Fatty_Acid_Degradation
440  Expanded Pertussis Toxin-Insensitive CCR5 Signaling In Macrophage
1100                              superpathway of alanine biosynthesis
1156                      Transcriptional Activation Of Dbpb From mRNA
277               Expanded Bioactive Peptide Induced Signaling Pathway
333                                      Expanded Fatty_Acid_Synthesis
552                                               Fatty_Acid_Synthesis
118                        Bioactive Peptide Induced Signaling Pathway
331                     Expanded Fatty_Acid_Beta_Oxidation_Meta_BiGCaT
549                              Fatty_Acid_Beta_Oxidation_Meta_BiGCaT
130                                     Cardiac Protection Against ROS
284                            Expanded Cardiac Protection Against ROS
56                                            alanine biosynthesis III
568                                     Free Radical Induced Apoptosis
659                                                HSP70_and_Apoptosis
330                        Expanded Fatty_Acid_Beta_Oxidation_1_BiGCaT
546                                 Fatty_Acid_Beta_Oxidation_1_BiGCaT
>
> ## Example which calls heatmap function on the resulting data
> widetable <- mirnaTable( mirnaobj, groups=NULL, format="Wide",
+     Significance=0.1, na.char=NA, pvalueTypes=c("pvalues") );
> ## Assign 1 to NA values, assuming they're all equally
> ## non-significant
> widetable[is.na(widetable)] <- 1;
>
> ## Display a heatmap of the result across sample groups
> pathwaycol <- mirnaobj@columns["pathwaycol"];
> pathwayidcol <- mirnaobj@columns["pathwayidcol"];
> rownames(widetable) <- apply(widetable[,c(pathwaycol,
+    pathwayidcol)], 1, function(i)paste(i, collapse="-"));
> wt <- as.matrix(widetable[3:dim(widetable)[2]], mode="numeric")
> heatmap(wt, scale="col");
>
> ## Show results where pathways are shared in four or more
> ## sample groups
> pathwaySubset <- apply(wt, 1, function(i)
+ {
+    length(i[i < 1]) >= 4;
+ } )
> heatmap(wt[pathwaySubset,], scale="row");
>
>
>
>
>
> dev.off()
null device
          1
>
|