R: Compare expression estimates between two methods
expressionComp
R Documentation
Compare expression estimates between two methods
Description
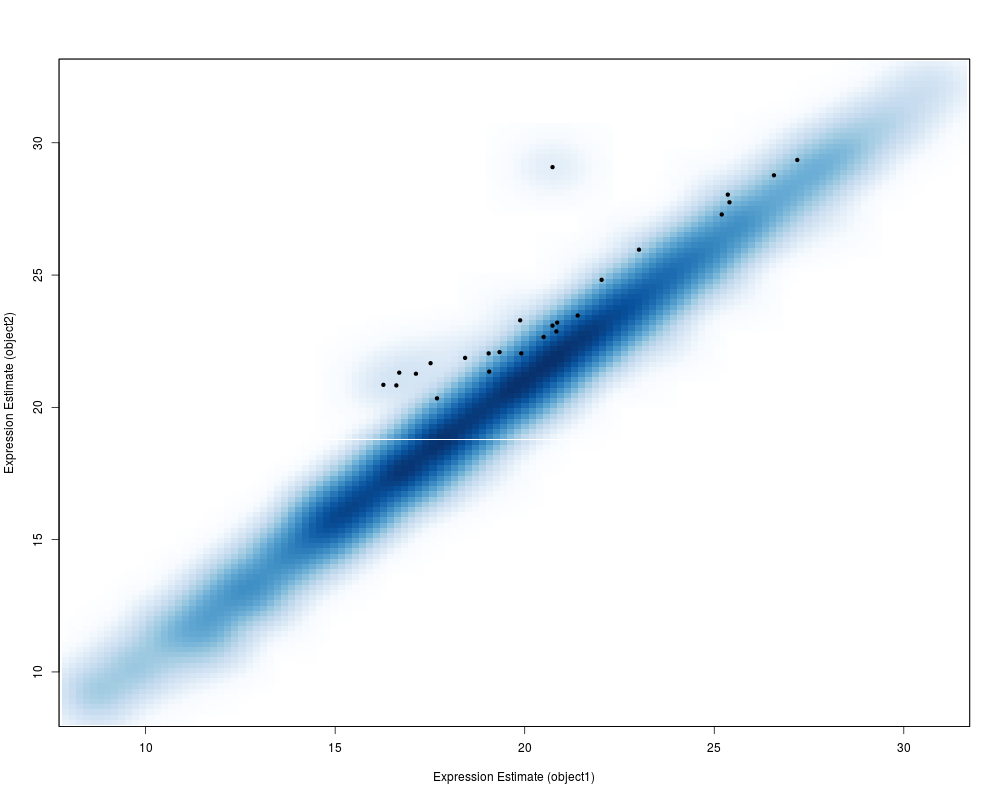
This function allows one to easily compare the expression estimates generated by two different algorithms. Feature / sample combinations that differ above a given threshold can be easily highlighted.
a list containing two elements: ct (the expression
estimates) and qc (quality scores)
qcThreshold1
a numeric threshold corresponding to object1$qc
below which values are considered low quality.
object2
a list containing two elements: ct (the expression
estimates) and qc (quality scores)
qcThreshold2
a numeric threshold corresponding to object2$qc
below which values are considered low quality.
label1
an optional label for plotting on the x-axis
label2
an optional label for plotting on the y-axis
diffThreshold
feature / sample combinations for which the expression estimates differ by more than this value are returned by the function and highlighted in the plot.
plotType
scatterplot or MA-plot
Value
This function plots the expresison estimates produced by two different methods. Feature / sample combinations for which the expression estimates differ by more than diffThreshold are returned by the function and highlighted in the plot.
R version 3.3.1 (2016-06-21) -- "Bug in Your Hair"
Copyright (C) 2016 The R Foundation for Statistical Computing
Platform: x86_64-pc-linux-gnu (64-bit)

R is free software and comes with ABSOLUTELY NO WARRANTY.
You are welcome to redistribute it under certain conditions.
Type 'license()' or 'licence()' for distribution details.

R is a collaborative project with many contributors.
Type 'contributors()' for more information and
'citation()' on how to cite R or R packages in publications.

Type 'demo()' for some demos, 'help()' for on-line help, or
'help.start()' for an HTML browser interface to help.
Type 'q()' to quit R.

> library(miRcomp)
Loading required package: Biobase
Loading required package: BiocGenerics
Loading required package: parallel

Attaching package: 'BiocGenerics'

The following objects are masked from 'package:parallel':

    clusterApply, clusterApplyLB, clusterCall, clusterEvalQ,
    clusterExport, clusterMap, parApply, parCapply, parLapply,
    parLapplyLB, parRapply, parSapply, parSapplyLB

The following objects are masked from 'package:stats':

    IQR, mad, xtabs

The following objects are masked from 'package:base':

    Filter, Find, Map, Position, Reduce, anyDuplicated, append,
    as.data.frame, cbind, colnames, do.call, duplicated, eval, evalq,
    get, grep, grepl, intersect, is.unsorted, lapply, lengths, mapply,
    match, mget, order, paste, pmax, pmax.int, pmin, pmin.int, rank,
    rbind, rownames, sapply, setdiff, sort, table, tapply, union,
    unique, unsplit

Welcome to Bioconductor

    Vignettes contain introductory material; view with
    'browseVignettes()'. To cite Bioconductor, see
    'citation("Biobase")', and for packages 'citation("pkgname")'.

Loading required package: miRcompData
> png(filename="/home/ddbj/snapshot/RGM3/R_BC/result/miRcomp/expressionComp.Rd_%03d_medium.png", width=480, height=480)
> ### Name: expressionComp
> ### Title: Compare expression estimates between two methods
> ### Aliases: expressionComp
> ### Keywords: manip
>
> ### ** Examples
>
>   data(lifetech)
>   data(qpcRdefault)
>   tmp <- expressionComp(object1=lifetech, qcThreshold1=1.25,
+   object2=qpcRdefault,qcThreshold2=0.99,plotType="scatter")
>
>
>
>
>
> dev.off()
null device
          1
>
 .
.