R: Assess the limit of detection of a given method
limitOfDetection
R Documentation
Assess the limit of detection of a given method
Description
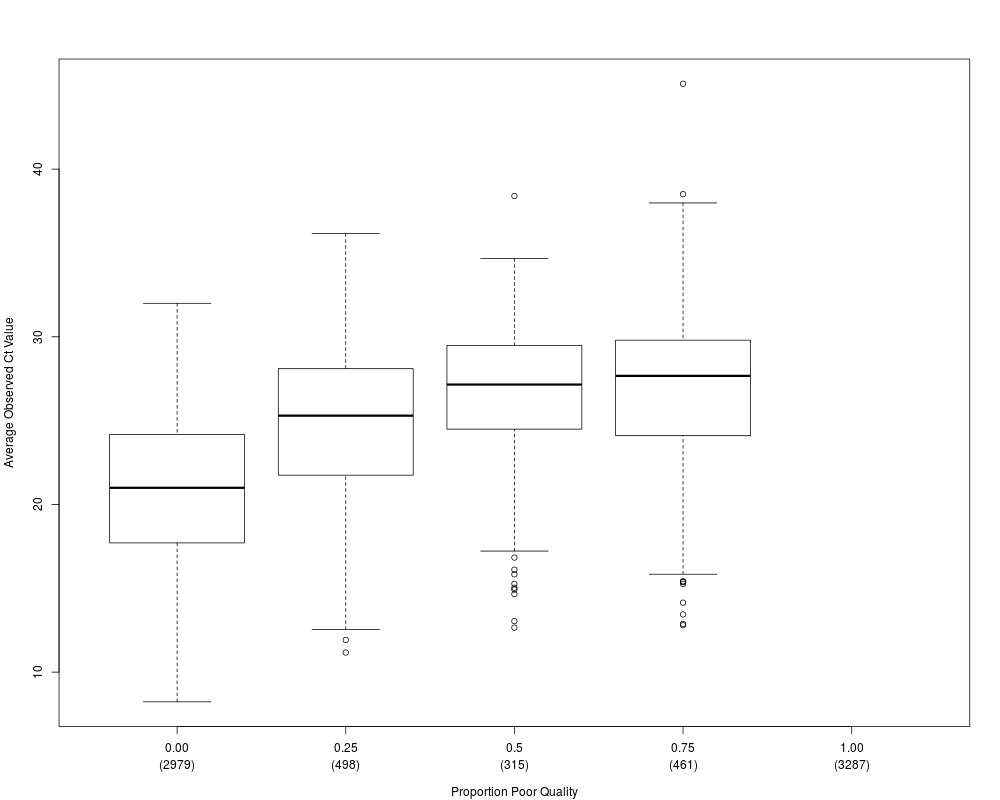
This function assesses the limit of detection in one of two ways: (1)
the distribution of expression estimates stratified by the proportion
of poor quality values within replicates, (2) the average vs expected
expression for the two most diluted sample types.
a list containing two elements: ct (the expression
estiamtes) and qc (quality scores)
qcThreshold
a numeric threshold corresponding to object1$qc
below which values are considered low quality.
plotType
the desired output type – boxplot is option (1);
scatterplot is option (2), an MA-plot is option (3).
Value
This function assesses the limit of detection in several ways. If
plotType is boxplot, then boxplots of expression estimates stratified
by the proportion of poor quality values within replicates is
displayed. The function also outputs a list with the values plotted in
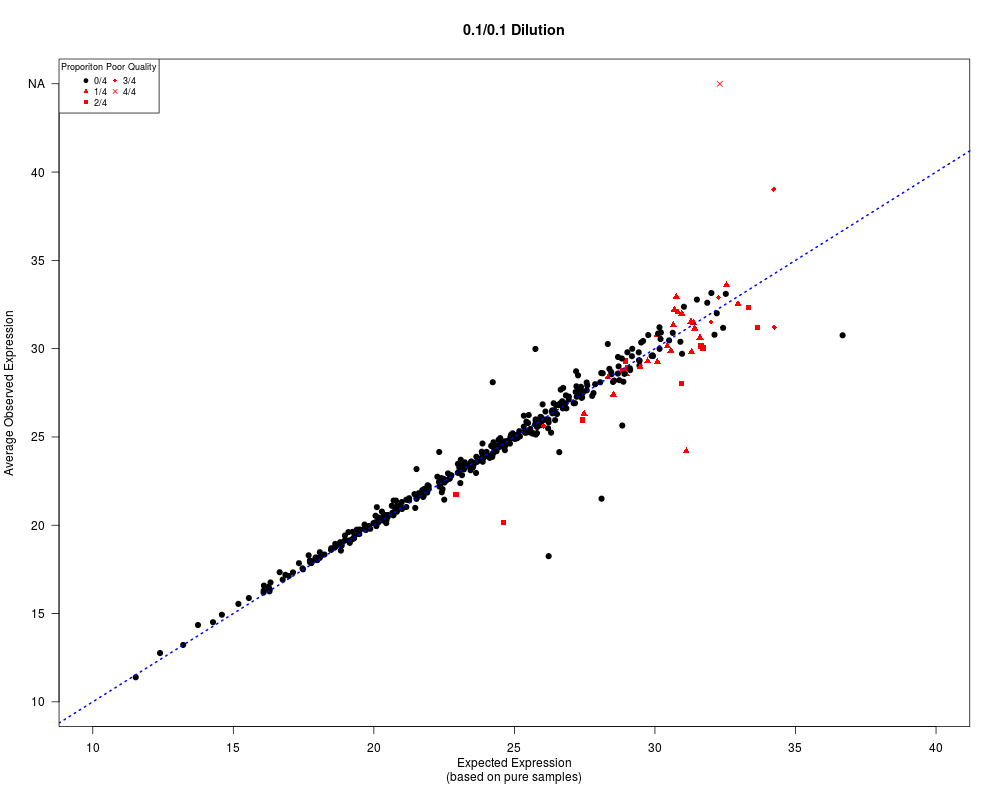
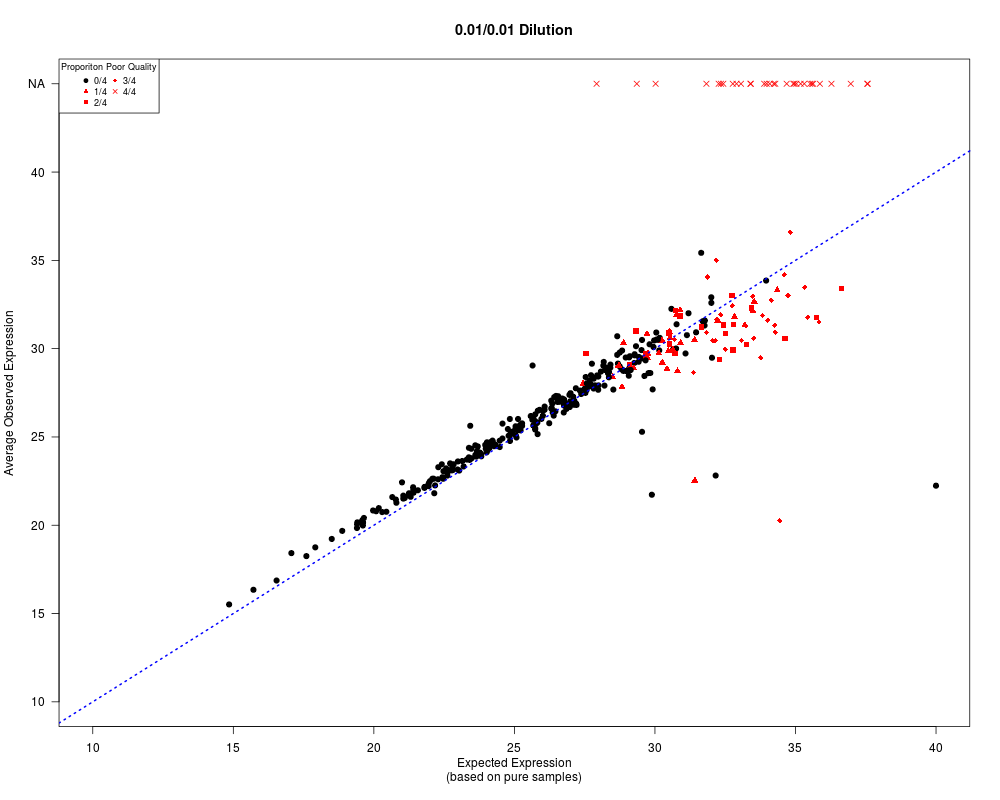
each box of the boxplot. If plotType is scatterplot, then the average within
replicate expression vs expected expression (based on pure sample
expression) is displayed for the 0.1/0.1 dilution and 0.01/0.01
dilution. If plotType is MAplot, then the difference in expression (average within
replicate expression - expected expression) is displayed for the
0.1/0.1 dilution and 0.01/0.01 dilution. For both plotTypes,
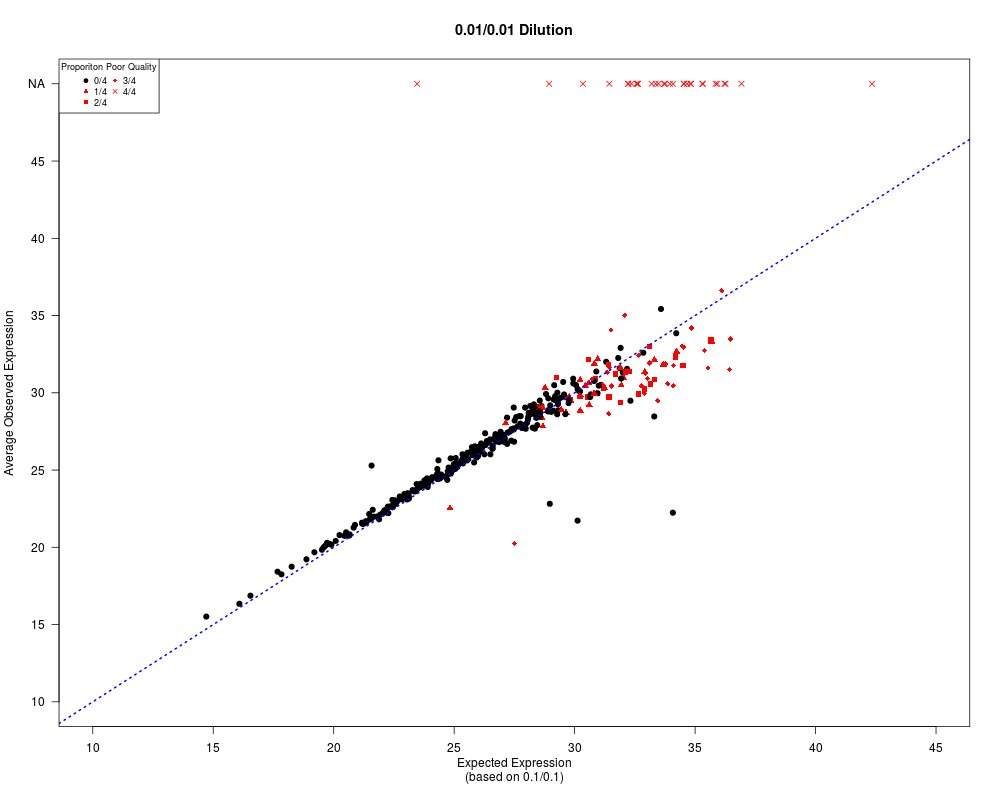
scatterplot and MAplot, the function outputs a matrix containing
estimates of the limit of detection for four different
tolerances. Specifically, the two columns
correspond to the two dilutions (0.1/0.1 and 0.01/0.01) and rows
correspond to the median difference between the observed and expected
values. The values in the matrix are the expected expression values
such that the median absolute difference of all larger expected
expression values is approximately equal to the given tolerance.
R version 3.3.1 (2016-06-21) -- "Bug in Your Hair"
Copyright (C) 2016 The R Foundation for Statistical Computing
Platform: x86_64-pc-linux-gnu (64-bit)

R is free software and comes with ABSOLUTELY NO WARRANTY.
You are welcome to redistribute it under certain conditions.
Type 'license()' or 'licence()' for distribution details.

R is a collaborative project with many contributors.
Type 'contributors()' for more information and
'citation()' on how to cite R or R packages in publications.

Type 'demo()' for some demos, 'help()' for on-line help, or
'help.start()' for an HTML browser interface to help.
Type 'q()' to quit R.

> library(miRcomp)
Loading required package: Biobase
Loading required package: BiocGenerics
Loading required package: parallel

Attaching package: 'BiocGenerics'

The following objects are masked from 'package:parallel':

    clusterApply, clusterApplyLB, clusterCall, clusterEvalQ,
    clusterExport, clusterMap, parApply, parCapply, parLapply,
    parLapplyLB, parRapply, parSapply, parSapplyLB

The following objects are masked from 'package:stats':

    IQR, mad, xtabs

The following objects are masked from 'package:base':

    Filter, Find, Map, Position, Reduce, anyDuplicated, append,
    as.data.frame, cbind, colnames, do.call, duplicated, eval, evalq,
    get, grep, grepl, intersect, is.unsorted, lapply, lengths, mapply,
    match, mget, order, paste, pmax, pmax.int, pmin, pmin.int, rank,
    rbind, rownames, sapply, setdiff, sort, table, tapply, union,
    unique, unsplit

Welcome to Bioconductor

    Vignettes contain introductory material; view with
    'browseVignettes()'. To cite Bioconductor, see
    'citation("Biobase")', and for packages 'citation("pkgname")'.

Loading required package: miRcompData
> png(filename="/home/ddbj/snapshot/RGM3/R_BC/result/miRcomp/limitOfDetection.Rd_%03d_medium.png", width=480, height=480)
> ### Name: limitOfDetection
> ### Title: Assess the limit of detection of a given method
> ### Aliases: limitOfDetection
> ### Keywords: manip
>
> ### ** Examples
>
>   data(lifetech)
>   tmp <- limitOfDetection(object=lifetech,qcThreshold=1.25)
>   data(qpcRdefault)
>   limitOfDetection(object=qpcRdefault,qcThreshold=0.99,plotType="scatter")
     0.1/0.1 vs pure 0.01/0.01 vs pure 0.01/0.01 vs 0.1/0.1
0.50            26.9              25.8                 25.3
0.75            29.2              28.3                 28.6
1.00            30.1              29.3                 29.9
>
>
>
>
>
> dev.off()
null device
          1
>
 .
.