a list containing two elements: ct (the expression
estiamtes) and qc (quality scores)
qcThreshold1
a numeric threshold corresponding to object1$qc below which values are considered low quality.
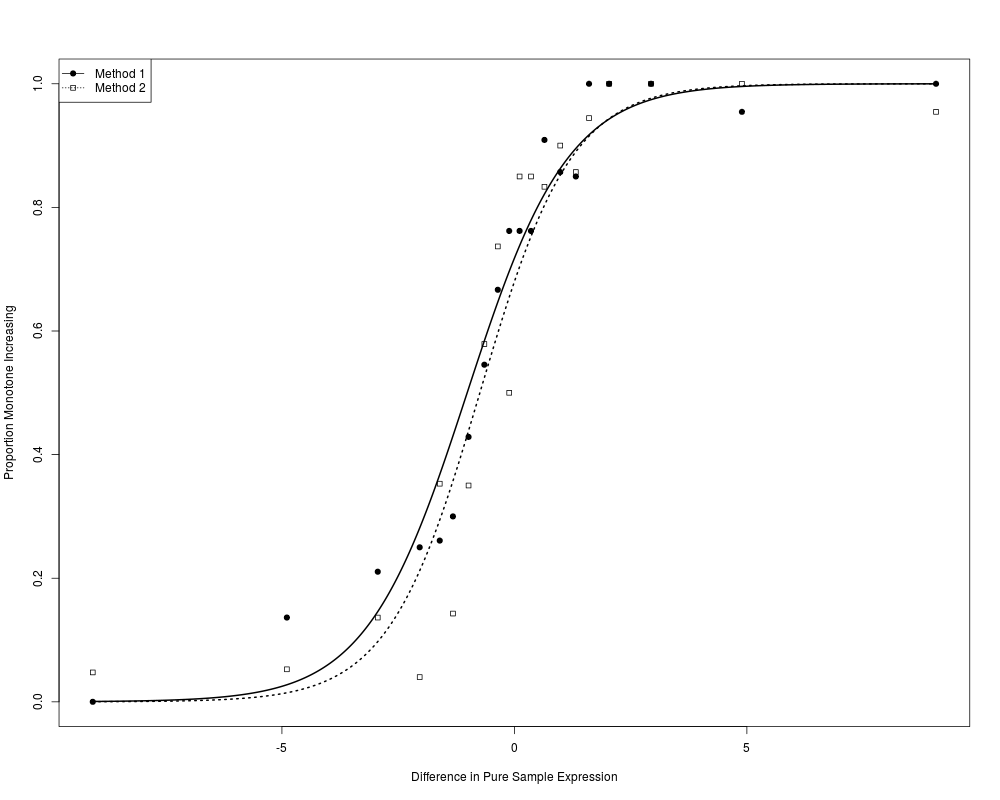
object2
an optional second list of the same format as
object1, used to compare two methods.
qcThreshold2
a numeric threshold corresponding to object2$qc
below which values are considered low quality.
commonFeatures
if TRUE and object2 is non-NULL, only high quality non-NA features in common between both objects are used.
label1
optional label corresponding to object 1 to be used in plotting.
label2
optional label corresponding to object 2 to be used in plotting.
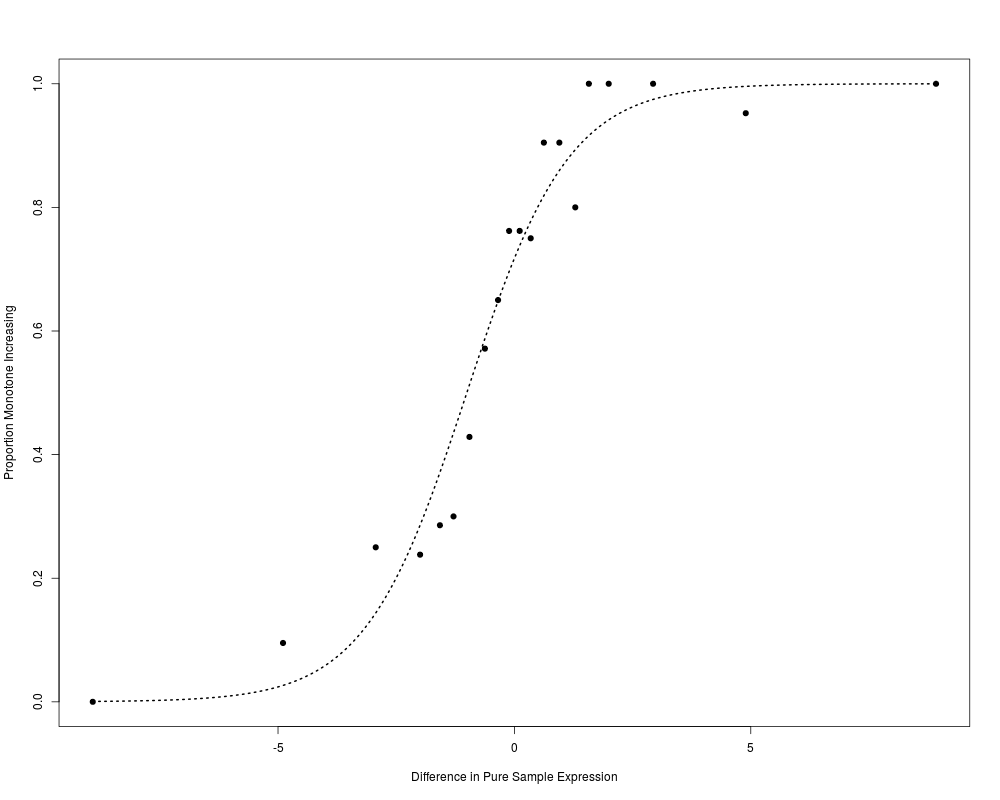
Value
A table listing the number of features showing a monotone
titration response and a figure showing the proportion
of features showing a monotone titration response vs the difference in
pure sample expression.
R version 3.3.1 (2016-06-21) -- "Bug in Your Hair"
Copyright (C) 2016 The R Foundation for Statistical Computing
Platform: x86_64-pc-linux-gnu (64-bit)

R is free software and comes with ABSOLUTELY NO WARRANTY.
You are welcome to redistribute it under certain conditions.
Type 'license()' or 'licence()' for distribution details.

R is a collaborative project with many contributors.
Type 'contributors()' for more information and
'citation()' on how to cite R or R packages in publications.

Type 'demo()' for some demos, 'help()' for on-line help, or
'help.start()' for an HTML browser interface to help.
Type 'q()' to quit R.

> library(miRcomp)
Loading required package: Biobase
Loading required package: BiocGenerics
Loading required package: parallel

Attaching package: 'BiocGenerics'

The following objects are masked from 'package:parallel':

    clusterApply, clusterApplyLB, clusterCall, clusterEvalQ,
    clusterExport, clusterMap, parApply, parCapply, parLapply,
    parLapplyLB, parRapply, parSapply, parSapplyLB

The following objects are masked from 'package:stats':

    IQR, mad, xtabs

The following objects are masked from 'package:base':

    Filter, Find, Map, Position, Reduce, anyDuplicated, append,
    as.data.frame, cbind, colnames, do.call, duplicated, eval, evalq,
    get, grep, grepl, intersect, is.unsorted, lapply, lengths, mapply,
    match, mget, order, paste, pmax, pmax.int, pmin, pmin.int, rank,
    rbind, rownames, sapply, setdiff, sort, table, tapply, union,
    unique, unsplit

Welcome to Bioconductor

    Vignettes contain introductory material; view with
    'browseVignettes()'. To cite Bioconductor, see
    'citation("Biobase")', and for packages 'citation("pkgname")'.

Loading required package: miRcompData
> png(filename="/home/ddbj/snapshot/RGM3/R_BC/result/miRcomp/titrationResponse.Rd_%03d_medium.png", width=480, height=480)
> ### Name: titrationResponse
> ### Title: Assess monotone signal across titration
> ### Aliases: titrationResponse
> ### Keywords: manip
>
> ### ** Examples
>
>   data(lifetech)
>   titrationResponse(object1=lifetech,qcThreshold1=1.25)
           A   B
Mono      98 164
Non-Mono 109  43
>   data(qpcRdefault)
>   titrationResponse(object1=lifetech,qcThreshold1=1.25,
+            object2=qpcRdefault,qcThreshold2=0.99)
         Method 1:A Method 2:A Method 1:B Method 2:B
Mono             96         84        163        161
Non-Mono        108        120         41         43
>
>
>
>
>
> dev.off()
null device
          1
>
 .
.