Supported by Dr. Osamu Ogasawara and  . . |
|
Last data update: 2014.03.03 |
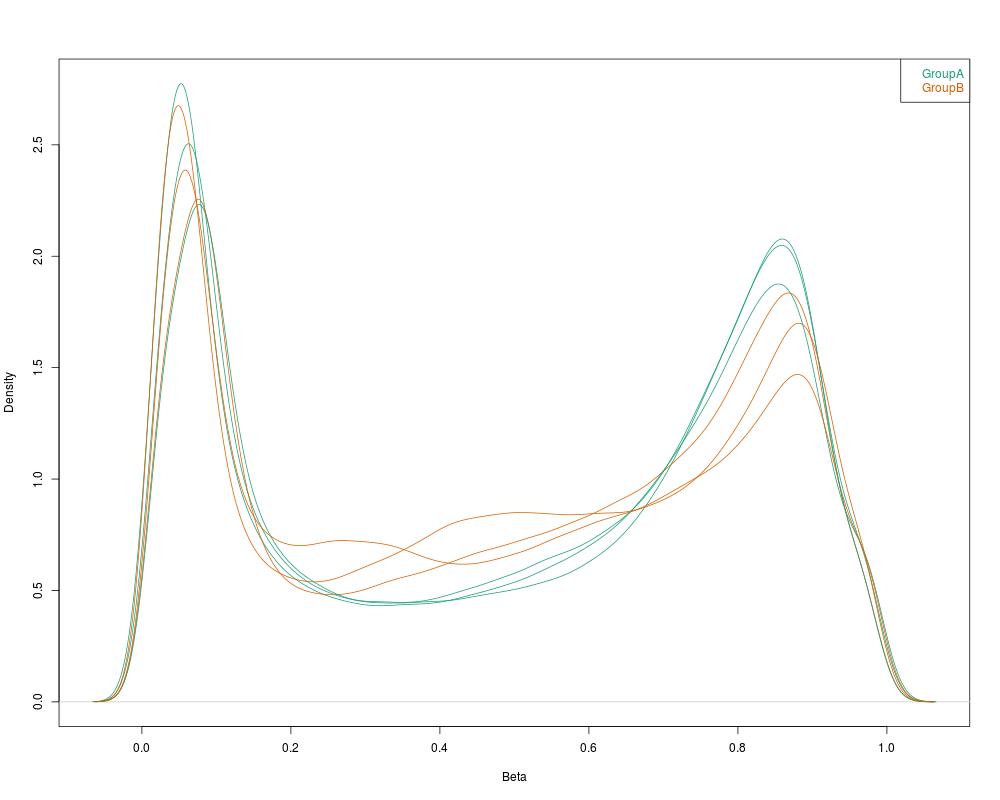
Density plots of methylation Beta values.DescriptionDensity plots of methylation Beta values, primarily for QC. Usage
densityPlot(dat, sampGroups = NULL, main = "", xlab = "Beta",
    pal = brewer.pal(8, "Dark2"), xlim, ylim, add = TRUE, legend = TRUE,
    ...)
Arguments
DetailsThis function produces the density plot component of the QC report. If ValueNo return value. Plots are produced as a side-effect. Author(s)Martin Aryee aryee@jhu.edu. See Also
Examples
if (require(minfiData)) {

groups <- pData(RGsetEx)$Sample_Group
densityPlot(RGsetEx, sampGroups=groups)

}
Results
R version 3.3.1 (2016-06-21) -- "Bug in Your Hair"
Copyright (C) 2016 The R Foundation for Statistical Computing
Platform: x86_64-pc-linux-gnu (64-bit)

R is free software and comes with ABSOLUTELY NO WARRANTY.
You are welcome to redistribute it under certain conditions.
Type 'license()' or 'licence()' for distribution details.

R is a collaborative project with many contributors.
Type 'contributors()' for more information and
'citation()' on how to cite R or R packages in publications.

Type 'demo()' for some demos, 'help()' for on-line help, or
'help.start()' for an HTML browser interface to help.
Type 'q()' to quit R.

> library(minfi)
Loading required package: BiocGenerics
Loading required package: parallel

Attaching package: 'BiocGenerics'

The following objects are masked from 'package:parallel':

    clusterApply, clusterApplyLB, clusterCall, clusterEvalQ,
    clusterExport, clusterMap, parApply, parCapply, parLapply,
    parLapplyLB, parRapply, parSapply, parSapplyLB

The following objects are masked from 'package:stats':

    IQR, mad, xtabs

The following objects are masked from 'package:base':

    Filter, Find, Map, Position, Reduce, anyDuplicated, append,
    as.data.frame, cbind, colnames, do.call, duplicated, eval, evalq,
    get, grep, grepl, intersect, is.unsorted, lapply, lengths, mapply,
    match, mget, order, paste, pmax, pmax.int, pmin, pmin.int, rank,
    rbind, rownames, sapply, setdiff, sort, table, tapply, union,
    unique, unsplit

Loading required package: Biobase
Welcome to Bioconductor

    Vignettes contain introductory material; view with
    'browseVignettes()'. To cite Bioconductor, see
    'citation("Biobase")', and for packages 'citation("pkgname")'.

Loading required package: lattice
Loading required package: GenomicRanges
Loading required package: S4Vectors
Loading required package: stats4

Attaching package: 'S4Vectors'

The following objects are masked from 'package:base':

    colMeans, colSums, expand.grid, rowMeans, rowSums

Loading required package: IRanges
Loading required package: GenomeInfoDb
Loading required package: SummarizedExperiment
Loading required package: Biostrings
Loading required package: XVector
Loading required package: bumphunter
Loading required package: foreach
Loading required package: iterators
Loading required package: locfit
locfit 1.5-9.1 	 2013-03-22
Setting options('download.file.method.GEOquery'='auto')
Setting options('GEOquery.inmemory.gpl'=FALSE)
> png(filename="/home/ddbj/snapshot/RGM3/R_BC/result/minfi/densityPlot.Rd_%03d_medium.png", width=480, height=480)
> ### Name: densityPlot
> ### Title: Density plots of methylation Beta values.
> ### Aliases: densityPlot
>
> ### ** Examples
>
> if (require(minfiData)) {
+
+ groups <- pData(RGsetEx)$Sample_Group
+ densityPlot(RGsetEx, sampGroups=groups)
+
+ }
Loading required package: minfiData
Loading required package: IlluminaHumanMethylation450kmanifest
Loading required package: IlluminaHumanMethylation450kanno.ilmn12.hg19
>
>
>
>
>
> dev.off()
null device
          1
>
|
Created & Maintained by Osamu Ogasawara (osamu.ogasawara@gmail.com) and 