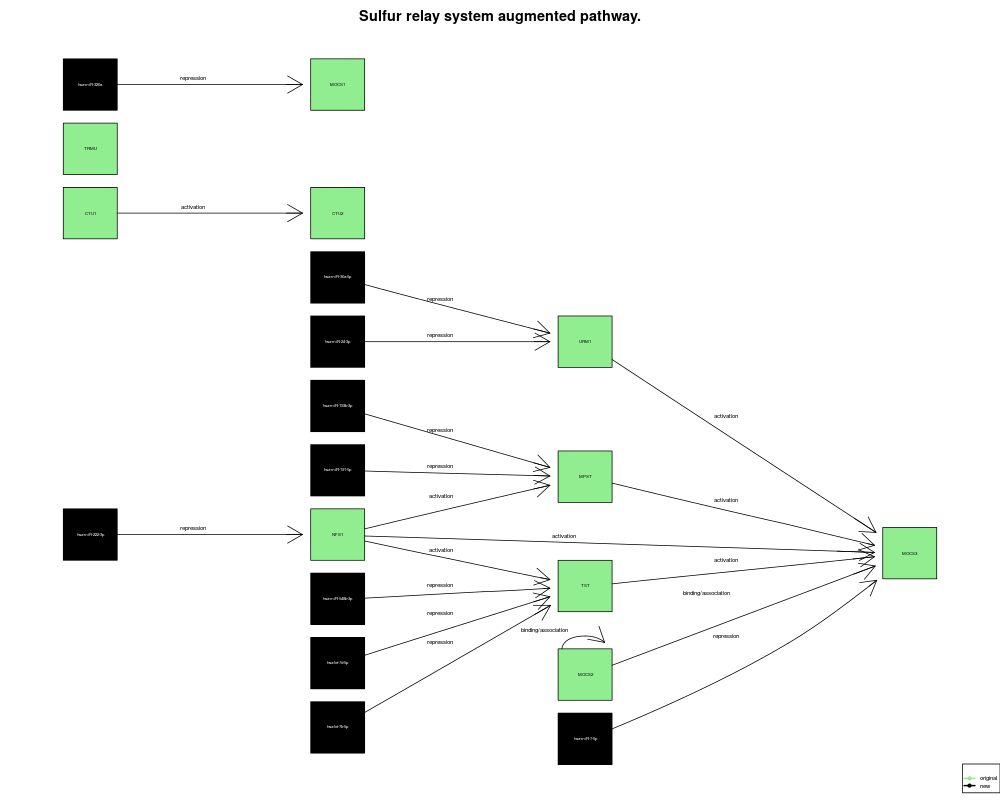
Functions for plotting a particular augmented pathway. In the plot,
miRNAs that were
added to the original pathway are differentiated from proteins that were
originally in the
pathway. Blue boxes represent the proteins that were part of the
original
pathway, and black boxes represent the miRNAs that were added during
augmentation.
A
graph::graphNEL object where each of the nodes is named with '<gene_ID>'.
Nodes of each graph::graphNEL represent the genes involved in the
pathway and edges represent the biological interactions (activation or
repression) among those genes.
augmented_pathway
A
graph::graphNEL object where each of the nodes is named with '<gene_ID>'.
Nodes of each graph::graphNEL represent genes
and miRNAs involved in the
pathway and edges represent the biological interactions (activation or
repression) among them.
pathway_name
The name of the pathway.
Value
A plot of one augmented pathway with the new nodes
highlighted in black.
R version 3.3.1 (2016-06-21) -- "Bug in Your Hair"
Copyright (C) 2016 The R Foundation for Statistical Computing
Platform: x86_64-pc-linux-gnu (64-bit)

R is free software and comes with ABSOLUTELY NO WARRANTY.
You are welcome to redistribute it under certain conditions.
Type 'license()' or 'licence()' for distribution details.

R is a collaborative project with many contributors.
Type 'contributors()' for more information and
'citation()' on how to cite R or R packages in publications.

Type 'demo()' for some demos, 'help()' for on-line help, or
'help.start()' for an HTML browser interface to help.
Type 'q()' to quit R.

> library(mirIntegrator)

> png(filename="/home/ddbj/snapshot/RGM3/R_BC/result/mirIntegrator/plot_augmented_pathway.Rd_%03d_medium.png", width=480, height=480)
> ### Name: plot_augmented_pathway
> ### Title: Plotting of augmented pathway
> ### Aliases: plot_augmented_pathway
>
> ### ** Examples
>
> data(augmented_pathways)
> data(kegg_pathways)
> data(names_pathways)
>
> plot_augmented_pathway(kegg_pathways[[18]], augmented_pathways[[18]],
+                       pathway_name = names_pathways[[18]])
>
>
>
>
>
> dev.off()
null device
          1
>
 .
.