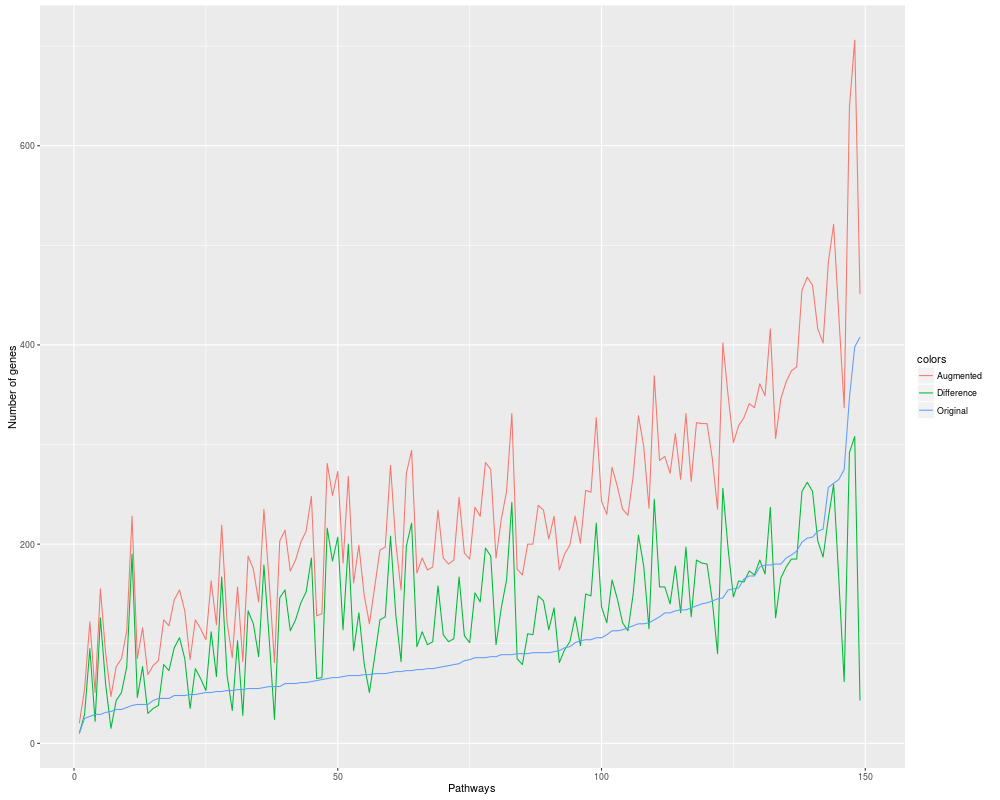
Function for plotting a lines plot of the difference in pathways' order.
The resultant plot shows the comparison between the order of the original
pathways
and the order of the augmented pathways. It also contains a line with
the order difference (order of the augmented pathways minus
order of the original pathways). The order of a biological pathway is
the number of genes that are involved in it.
A list of
graph::graphNEL objects where each of the nodes is named with '<gene_ID>'.
Nodes of each graph::graphNEL represent the genes involved in the
pathway and edges represent the biological interactions (activation or
repression) among those genes (activation or repression).
augmented_pathways
A list of
graph::graphNEL objects where each of the nodes is named with '<gene_ID>'.
Nodes of each graph::graphNEL represent genes
and miRNAs involved in the
pathway and edges represent the biological interactions (activation or
repression) among them.
pathway_names
A list of names of the pathways named by '<pathway_ID>'.
R version 3.3.1 (2016-06-21) -- "Bug in Your Hair"
Copyright (C) 2016 The R Foundation for Statistical Computing
Platform: x86_64-pc-linux-gnu (64-bit)

R is free software and comes with ABSOLUTELY NO WARRANTY.
You are welcome to redistribute it under certain conditions.
Type 'license()' or 'licence()' for distribution details.

R is a collaborative project with many contributors.
Type 'contributors()' for more information and
'citation()' on how to cite R or R packages in publications.

Type 'demo()' for some demos, 'help()' for on-line help, or
'help.start()' for an HTML browser interface to help.
Type 'q()' to quit R.

> library(mirIntegrator)

> png(filename="/home/ddbj/snapshot/RGM3/R_BC/result/mirIntegrator/plot_change.Rd_%03d_medium.png", width=480, height=480)
> ### Name: plot_change
> ### Title: Plotting the change in pathways order
> ### Aliases: plot_change
>
> ### ** Examples
>
> data(augmented_pathways)
> data(kegg_pathways)
> data(names_pathways)
> plot_change(kegg_pathways,augmented_pathways, names_pathways)
Warning message:
Removed 3 rows containing missing values (geom_path).
>
>
>
>
>
> dev.off()
null device
          1
>
 .
.