Supported by Dr. Osamu Ogasawara and  . . |
|
Last data update: 2014.03.03 |
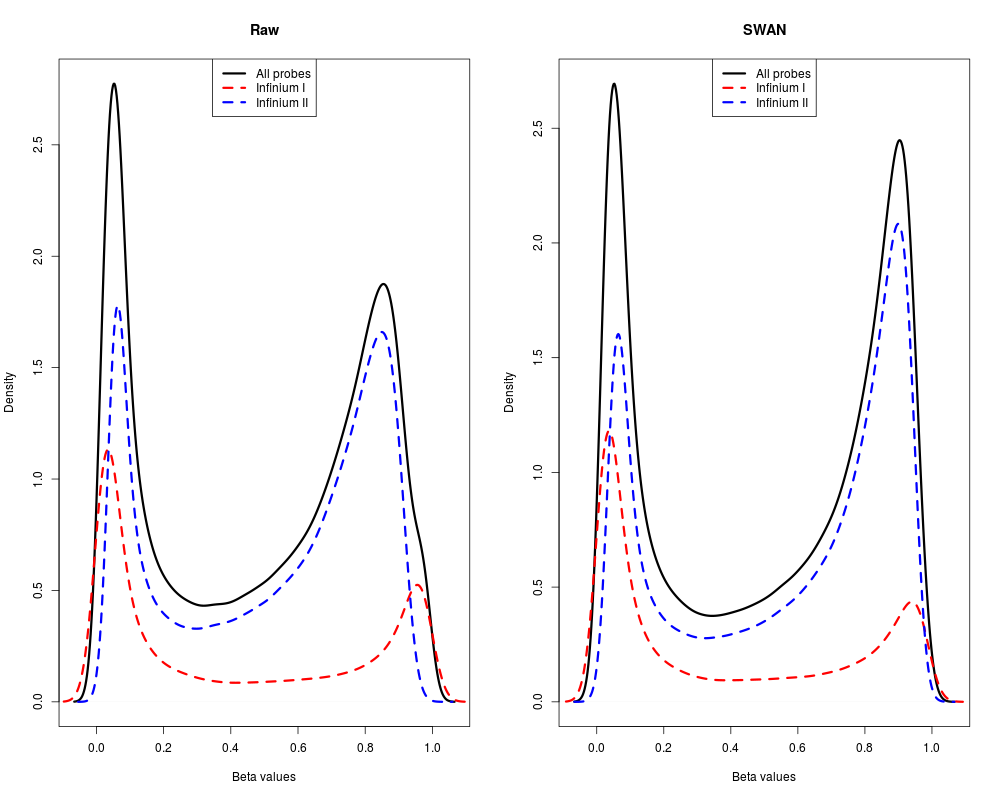
Plot the beta value distributions of the Infinium I and II probe types relative to the overall beta value distribution.DescriptionPlot the overall density distribution of beta values and the density distributions of the Infinium I and II probe types. Usage
densityByProbeType(data, legendPos = "top", colors = c("black", "red", "blue"), main = "", lwd = 3, cex.legend = 1)
Arguments
DetailsThe density distribution of the beta values for a single sample is
plotted. The density distributions of the Infinium I and II probes are
then plotted individually, showing how they contribute to the overall
distribution. This is useful for visualising how using
Author(s)Jovana Maksimovic jovana.maksimovic@mcri.edu.au. ReferencesNo return value. Plot is produced as a side-effect. See Also
Examples
if (require(minfi) & require(minfiData)) {
  dat <- preprocessRaw(RGsetEx)
  datSwan <- SWAN(dat)
  par(mfrow=c(1,2))
  densityByProbeType(dat[,1], main="Raw")
  densityByProbeType(datSwan[,1], main="SWAN")
}
Results
R version 3.3.1 (2016-06-21) -- "Bug in Your Hair"
Copyright (C) 2016 The R Foundation for Statistical Computing
Platform: x86_64-pc-linux-gnu (64-bit)

R is free software and comes with ABSOLUTELY NO WARRANTY.
You are welcome to redistribute it under certain conditions.
Type 'license()' or 'licence()' for distribution details.

R is a collaborative project with many contributors.
Type 'contributors()' for more information and
'citation()' on how to cite R or R packages in publications.

Type 'demo()' for some demos, 'help()' for on-line help, or
'help.start()' for an HTML browser interface to help.
Type 'q()' to quit R.

> library(missMethyl)
Setting options('download.file.method.GEOquery'='auto')
Setting options('GEOquery.inmemory.gpl'=FALSE)

> png(filename="/home/ddbj/snapshot/RGM3/R_BC/result/missMethyl/densityByProbeType.Rd_%03d_medium.png", width=480, height=480)
> ### Name: densityByProbeType
> ### Title: Plot the beta value distributions of the Infinium I and II probe
> ###   types relative to the overall beta value distribution.
> ### Aliases: densityByProbeType
>
> ### ** Examples
>
> if (require(minfi) & require(minfiData)) {
+   dat <- preprocessRaw(RGsetEx)
+   datSwan <- SWAN(dat)
+   par(mfrow=c(1,2))
+   densityByProbeType(dat[,1], main="Raw")
+   densityByProbeType(datSwan[,1], main="SWAN")
+ }
Loading required package: minfi
Loading required package: BiocGenerics
Loading required package: parallel

Attaching package: 'BiocGenerics'

The following objects are masked from 'package:parallel':

    clusterApply, clusterApplyLB, clusterCall, clusterEvalQ,
    clusterExport, clusterMap, parApply, parCapply, parLapply,
    parLapplyLB, parRapply, parSapply, parSapplyLB

The following objects are masked from 'package:stats':

    IQR, mad, xtabs

The following objects are masked from 'package:base':

    Filter, Find, Map, Position, Reduce, anyDuplicated, append,
    as.data.frame, cbind, colnames, do.call, duplicated, eval, evalq,
    get, grep, grepl, intersect, is.unsorted, lapply, lengths, mapply,
    match, mget, order, paste, pmax, pmax.int, pmin, pmin.int, rank,
    rbind, rownames, sapply, setdiff, sort, table, tapply, union,
    unique, unsplit

Loading required package: Biobase
Welcome to Bioconductor

    Vignettes contain introductory material; view with
    'browseVignettes()'. To cite Bioconductor, see
    'citation("Biobase")', and for packages 'citation("pkgname")'.

Loading required package: lattice
Loading required package: GenomicRanges
Loading required package: S4Vectors
Loading required package: stats4

Attaching package: 'S4Vectors'

The following objects are masked from 'package:base':

    colMeans, colSums, expand.grid, rowMeans, rowSums

Loading required package: IRanges
Loading required package: GenomeInfoDb
Loading required package: SummarizedExperiment
Loading required package: Biostrings
Loading required package: XVector
Loading required package: bumphunter
Loading required package: foreach
Loading required package: iterators
Loading required package: locfit
locfit 1.5-9.1 	 2013-03-22
Loading required package: minfiData
Loading required package: IlluminaHumanMethylation450kmanifest
Loading required package: IlluminaHumanMethylation450kanno.ilmn12.hg19
[SWAN] Preparing normalization subset
[SWAN] Normalizing methylated channel
[SWAN] Normalizing unmethylated channel
>
>
>
>
>
> dev.off()
null device
          1
>
|