Supported by Dr. Osamu Ogasawara and  . . |
|
Last data update: 2014.03.03 |
Obtain Levene residualsDescriptionObtain absolute or squared Levene residuals for each CpG given a series of methylation arrays UsagegetLeveneResiduals(data, design = NULL, type = NULL) Arguments
DetailsThis function will return absolute or squared Levene residuals given a matrix of M values and a design matrix. This can be used for graphing purposes or for downstream analysis such a gene set testing based on differential variability rather than differential methylation. If no design matrix is given, the residuals are determined by treating all samples as coming from one group. ValueReturns a list with three components. Author(s)Belinda Phipson ReferencesPhipson, B., and Oshlack, A. (2014). A method for detecting differential variability in methylation data shows CpG islands are highly variably methylated in cancers. Genome Biology, 15:465. See Also
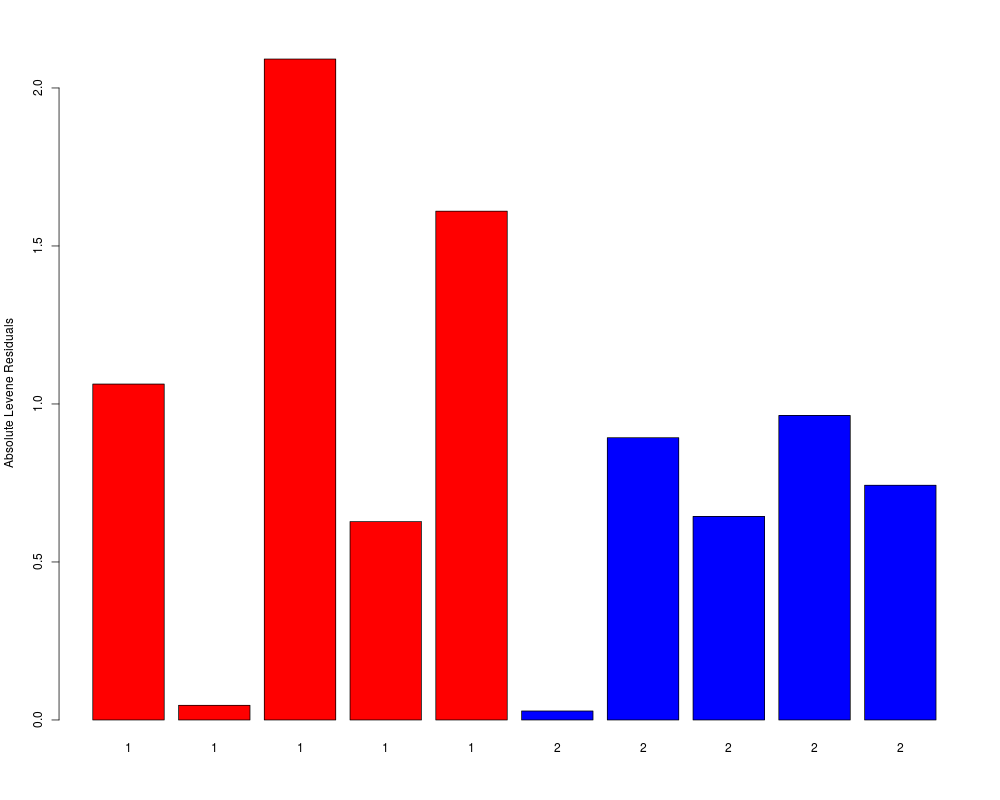
Examples# Randomly generate data for a 2 group problem with 100 CpG sites and 5 arrays in each group y <- matrix(rnorm(1000),ncol=10) group <- factor(rep(c(1,2),each=5)) design <- model.matrix(~group) # Get absolute Levene Residuals resid <- getLeveneResiduals(y,design) # Plot the first CpG barplot(resid$data[1,],col=rep(c(2,4),each=5),ylab="Absolute Levene Residuals",names=group) Results
R version 3.3.1 (2016-06-21) -- "Bug in Your Hair"
Copyright (C) 2016 The R Foundation for Statistical Computing
Platform: x86_64-pc-linux-gnu (64-bit)

R is free software and comes with ABSOLUTELY NO WARRANTY.
You are welcome to redistribute it under certain conditions.
Type 'license()' or 'licence()' for distribution details.

R is a collaborative project with many contributors.
Type 'contributors()' for more information and
'citation()' on how to cite R or R packages in publications.

Type 'demo()' for some demos, 'help()' for on-line help, or
'help.start()' for an HTML browser interface to help.
Type 'q()' to quit R.

> library(missMethyl)
Setting options('download.file.method.GEOquery'='auto')
Setting options('GEOquery.inmemory.gpl'=FALSE)

> png(filename="/home/ddbj/snapshot/RGM3/R_BC/result/missMethyl/getLeveneResiduals.Rd_%03d_medium.png", width=480, height=480)
> ### Name: getLeveneResiduals
> ### Title: Obtain Levene residuals
> ### Aliases: getLeveneResiduals
>
> ### ** Examples
>
> # Randomly generate data for a 2 group problem with 100 CpG sites and 5 arrays in each group
> y <- matrix(rnorm(1000),ncol=10)
>
> group <- factor(rep(c(1,2),each=5))
> design <- model.matrix(~group)
>
> # Get absolute Levene Residuals
> resid <- getLeveneResiduals(y,design)
>
> # Plot the first CpG
> barplot(resid$data[1,],col=rep(c(2,4),each=5),ylab="Absolute Levene Residuals",names=group)
>
>
>
>
>
> dev.off()
null device
          1
>
|