Supported by Dr. Osamu Ogasawara and  . . |
|
Last data update: 2014.03.03 |
Gene ontology testing for 450K methylation dataDescriptionTests gene ontology enrichment for significant CpGs from Illumina's Infinium HumanMethylation450 array, taking into account the differing number of probes per gene present on the array. Usagegometh(sig.cpg, all.cpg = NULL, collection = "GO", plot.bias = FALSE, prior.prob = TRUE) Arguments
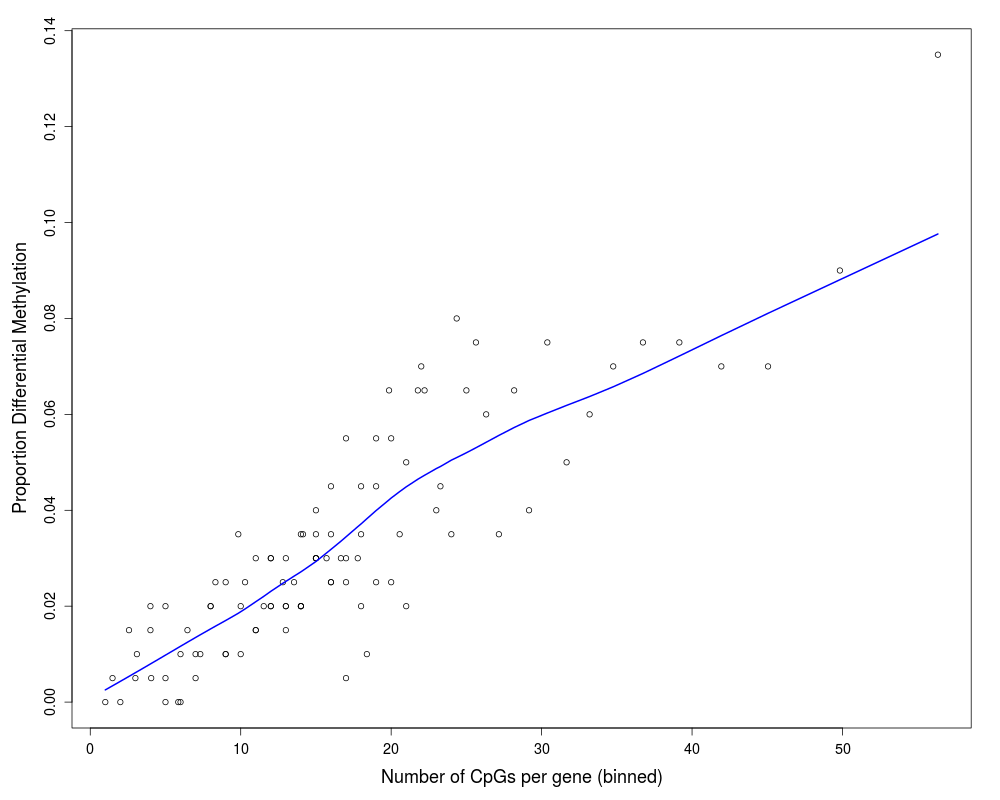
DetailsThis function takes a character vector of significant CpG sites, maps the CpG sites to Entrez Gene IDs, and tests for GO term or KEGG pathway enrichment using a hypergeometric test, taking into account the number of CpG sites per gene on the 450K array. Geeleher et al. (2013) showed that a severe bias exists when performing gene set analysis for genome-wide methylation data that occurs due to the differing numbers of CpG sites profiled for each gene. Genes associated with each CpG site are obtained from the annotation package
The For more generalised gene set testing where the user can specify the gene set/s of interest to be tested, please use the ValueA data frame with a row for each GO or KEGG term and the following columns:
Author(s)Belinda Phipson ReferencesGeeleher, P., Hartnett, L., Egan, L. J., Golden, A., Ali, R. A. R., and Seoighe, C. (2013). Gene-set analysis is severely biased when applied to genome-wide methylation data. Bioinformatics, 29(15), 1851–1857. Young, M. D., Wakefield, M. J., Smyth, G. K., and Oshlack, A. (2010). Gene ontology analysis for RNA-seq: accounting for selection bias. Genome Biology, 11, R14. Ritchie, M. E., Phipson, B., Wu, D., Hu, Y., Law, C. W., Shi, W., and Smyth, G. K. (2015). limma powers differential expression analyses for RNA-sequencing and microarray studies. Nucleic Acids Research, gkv007. Benjamini, Y., and Hochberg, Y. (1995). Controlling the false discovery rate: a practical and powerful approach to multiple testing. Journal of the Royal Statistical Society Series, B, 57, 289-300. See Also
Exampleslibrary(IlluminaHumanMethylation450kanno.ilmn12.hg19) library(limma) ann <- getAnnotation(IlluminaHumanMethylation450kanno.ilmn12.hg19) # Randomly select 1000 CpGs to be significantly differentially methylated sigcpgs <- sample(rownames(ann),1000,replace=FALSE) # All CpG sites tested allcpgs <- rownames(ann) # GO testing with prior probabilities taken into account # Plot of bias due to differing numbers of CpG sites per gene gst <- gometh(sig.cpg = sigcpgs, all.cpg = allcpgs, collection = "GO", plot.bias = TRUE, prior.prob = TRUE) # Total number of GO categories significant at 5% FDR table(gst$FDR<0.05) # Table of top GO results topGO(gst) # GO testing ignoring bias gst.bias <- gometh(sig.cpg = sigcpgs, all.cpg = allcpgs, collection = "GO", prior.prob=FALSE) # Total number of GO categories significant at 5% FDR ignoring bias table(gst.bias$FDR<0.05) # Table of top GO results ignoring bias topGO(gst.bias) # KEGG testing kegg <- gometh(sig.cpg = sigcpgs, all.cpg = allcpgs, collection = "KEGG", prior.prob=TRUE) # Table of top KEGG results topKEGG(kegg) Results
R version 3.3.1 (2016-06-21) -- "Bug in Your Hair"
Copyright (C) 2016 The R Foundation for Statistical Computing
Platform: x86_64-pc-linux-gnu (64-bit)

R is free software and comes with ABSOLUTELY NO WARRANTY.
You are welcome to redistribute it under certain conditions.
Type 'license()' or 'licence()' for distribution details.

R is a collaborative project with many contributors.
Type 'contributors()' for more information and
'citation()' on how to cite R or R packages in publications.

Type 'demo()' for some demos, 'help()' for on-line help, or
'help.start()' for an HTML browser interface to help.
Type 'q()' to quit R.

> library(missMethyl)
Setting options('download.file.method.GEOquery'='auto')
Setting options('GEOquery.inmemory.gpl'=FALSE)

> png(filename="/home/ddbj/snapshot/RGM3/R_BC/result/missMethyl/gometh.Rd_%03d_medium.png", width=480, height=480)
> ### Name: gometh
> ### Title: Gene ontology testing for 450K methylation data
> ### Aliases: gometh
>
> ### ** Examples
>
> library(IlluminaHumanMethylation450kanno.ilmn12.hg19)
Loading required package: minfi
Loading required package: BiocGenerics
Loading required package: parallel

Attaching package: 'BiocGenerics'

The following objects are masked from 'package:parallel':

    clusterApply, clusterApplyLB, clusterCall, clusterEvalQ,
    clusterExport, clusterMap, parApply, parCapply, parLapply,
    parLapplyLB, parRapply, parSapply, parSapplyLB

The following objects are masked from 'package:stats':

    IQR, mad, xtabs

The following objects are masked from 'package:base':

    Filter, Find, Map, Position, Reduce, anyDuplicated, append,
    as.data.frame, cbind, colnames, do.call, duplicated, eval, evalq,
    get, grep, grepl, intersect, is.unsorted, lapply, lengths, mapply,
    match, mget, order, paste, pmax, pmax.int, pmin, pmin.int, rank,
    rbind, rownames, sapply, setdiff, sort, table, tapply, union,
    unique, unsplit

Loading required package: Biobase
Welcome to Bioconductor

    Vignettes contain introductory material; view with
    'browseVignettes()'. To cite Bioconductor, see
    'citation("Biobase")', and for packages 'citation("pkgname")'.

Loading required package: lattice
Loading required package: GenomicRanges
Loading required package: S4Vectors
Loading required package: stats4

Attaching package: 'S4Vectors'

The following objects are masked from 'package:base':

    colMeans, colSums, expand.grid, rowMeans, rowSums

Loading required package: IRanges
Loading required package: GenomeInfoDb
Loading required package: SummarizedExperiment
Loading required package: Biostrings
Loading required package: XVector
Loading required package: bumphunter
Loading required package: foreach
Loading required package: iterators
Loading required package: locfit
locfit 1.5-9.1 	 2013-03-22
> library(limma)

Attaching package: 'limma'

The following object is masked from 'package:BiocGenerics':

    plotMA

> ann <- getAnnotation(IlluminaHumanMethylation450kanno.ilmn12.hg19)
>
> # Randomly select 1000 CpGs to be significantly differentially methylated
> sigcpgs <- sample(rownames(ann),1000,replace=FALSE)
>
> # All CpG sites tested
> allcpgs <- rownames(ann)
>
> # GO testing with prior probabilities taken into account
> # Plot of bias due to differing numbers of CpG sites per gene
> gst <- gometh(sig.cpg = sigcpgs, all.cpg = allcpgs, collection = "GO", plot.bias = TRUE, prior.prob = TRUE)
Warning message:
In alias2SymbolTable(flat$symbol) :
  Multiple symbols ignored for one or more aliases
>
> # Total number of GO categories significant at 5% FDR
> table(gst$FDR<0.05)

FALSE  TRUE
20818     1
>
> # Table of top GO results
> topGO(gst)
                                                                      Term Ont
GO:0007156 homophilic cell adhesion via plasma membrane adhesion molecules  BP
GO:0098742       cell-cell adhesion via plasma-membrane adhesion molecules  BP
GO:0070652                                                    HAUS complex  CC
GO:0016841                                          ammonia-lyase activity  MF
GO:0016222                       procollagen-proline 4-dioxygenase complex  CC
GO:0005509                                             calcium ion binding  MF
GO:0015949            nucleobase-containing small molecule interconversion  BP
GO:0004656                      procollagen-proline 4-dioxygenase activity  MF
GO:0043167                                                     ion binding  MF
GO:0000301            retrograde transport, vesicle recycling within Golgi  BP
GO:0034067                         protein localization to Golgi apparatus  BP
GO:0043169                                                  cation binding  MF
GO:0019201                                      nucleotide kinase activity  MF
GO:0016840                                  carbon-nitrogen lyase activity  MF
GO:0046872                                               metal ion binding  MF
GO:0007399                                      nervous system development  BP
GO:0019205                  nucleobase-containing compound kinase activity  MF
GO:0016776        phosphotransferase activity, phosphate group as acceptor  MF
GO:0001871                                                 pattern binding  MF
GO:0030247                                          polysaccharide binding  MF
              N  DE         P.DE         FDR
GO:0007156  154  29 6.065409e-08 0.001262757
GO:0098742  217  29 1.347372e-05 0.140254723
GO:0070652    8   4 5.547172e-05 0.384955271
GO:0016841    5   3 1.670618e-04 0.869515099
GO:0016222    3   3 2.684237e-04 1.000000000
GO:0005509  673  54 3.188406e-04 1.000000000
GO:0015949   23   6 5.098052e-04 1.000000000
GO:0004656    4   3 6.979136e-04 1.000000000
GO:0043167 5925 309 9.487016e-04 1.000000000
GO:0000301   22   5 1.053951e-03 1.000000000
GO:0034067   30   6 1.070581e-03 1.000000000
GO:0043169 4064 220 1.078554e-03 1.000000000
GO:0019201   22   6 1.105105e-03 1.000000000
GO:0016840    9   3 1.368202e-03 1.000000000
GO:0046872 3981 216 1.399208e-03 1.000000000
GO:0007399 2358 158 1.608955e-03 1.000000000
GO:0019205   47   8 1.625648e-03 1.000000000
GO:0016776   39   7 1.848741e-03 1.000000000
GO:0001871   20   4 2.038351e-03 1.000000000
GO:0030247   20   4 2.038351e-03 1.000000000
>
> # GO testing ignoring bias
> gst.bias <- gometh(sig.cpg = sigcpgs, all.cpg = allcpgs, collection = "GO", prior.prob=FALSE)
Warning message:
In alias2SymbolTable(flat$symbol) :
  Multiple symbols ignored for one or more aliases
>
> # Total number of GO categories significant at 5% FDR ignoring bias
> table(gst.bias$FDR<0.05)

FALSE  TRUE
20797    22
>
> # Table of top GO results ignoring bias
> topGO(gst.bias)
                                                                      Term Ont
GO:0007156 homophilic cell adhesion via plasma membrane adhesion molecules  BP
GO:0007399                                      nervous system development  BP
GO:0098742       cell-cell adhesion via plasma-membrane adhesion molecules  BP
GO:0043167                                                     ion binding  MF
GO:0048731                                              system development  BP
GO:0005509                                             calcium ion binding  MF
GO:0048856                                anatomical structure development  BP
GO:0007275                              multicellular organism development  BP
GO:0043169                                                  cation binding  MF
GO:0046872                                               metal ion binding  MF
GO:0048699                                           generation of neurons  BP
GO:0044463                                            cell projection part  CC
GO:0022008                                                    neurogenesis  BP
GO:0044767                           single-organism developmental process  BP
GO:0044707                           single-multicellular organism process  BP
GO:0030030                                    cell projection organization  BP
GO:0048666                                              neuron development  BP
GO:0009888                                              tissue development  BP
GO:0031175                                   neuron projection development  BP
GO:0032502                                           developmental process  BP
              N  DE         P.DE          FDR
GO:0007156  154  29 6.246615e-12 1.300483e-07
GO:0007399 2358 158 2.536967e-10 2.640856e-06
GO:0098742  217  29 2.587790e-08 1.795840e-04
GO:0043167 5925 309 3.644974e-07 1.897118e-03
GO:0048731 4343 234 2.383870e-06 7.998401e-03
GO:0005509  673  54 2.592725e-06 7.998401e-03
GO:0048856 5117 268 3.008553e-06 7.998401e-03
GO:0007275 4893 258 3.073500e-06 7.998401e-03
GO:0043169 4064 220 4.085029e-06 9.299885e-03
GO:0046872 3981 216 4.467018e-06 9.299885e-03
GO:0048699 1600 102 6.443293e-06 1.219481e-02
GO:0044463  950  68 7.105711e-06 1.232782e-02
GO:0022008 1682 105 1.151677e-05 1.844366e-02
GO:0044767 5671 288 1.428544e-05 2.124347e-02
GO:0044707 6002 302 1.624850e-05 2.255183e-02
GO:0030030 1480  94 1.797495e-05 2.338878e-02
GO:0048666 1229  81 1.996647e-05 2.444103e-02
GO:0009888 1767 108 2.113159e-05 2.444103e-02
GO:0031175 1092  73 3.321634e-05 3.622863e-02
GO:0032502 5755 289 3.480343e-05 3.622863e-02
>
> # KEGG testing
> kegg <- gometh(sig.cpg = sigcpgs, all.cpg = allcpgs, collection = "KEGG", prior.prob=TRUE)
Warning message:
In alias2SymbolTable(flat$symbol) :
  Multiple symbols ignored for one or more aliases
>
> # Table of top KEGG results
> topKEGG(kegg)
                                                  Pathway    N DE         P.DE
path:hsa01100                          Metabolic pathways 1210 56 1.147839e-23
path:hsa04310                       Wnt signaling pathway  142 15 5.113888e-10
path:hsa04650   Natural killer cell mediated cytotoxicity  118 11 4.714969e-08
path:hsa05031                       Amphetamine addiction   67  9 1.368826e-07
path:hsa04141 Protein processing in endoplasmic reticulum  165 11 6.436094e-07
path:hsa05166                            HTLV-I infection  255 15 6.860358e-07
path:hsa03013                               RNA transport  166 10 1.976009e-06
path:hsa05200                          Pathways in cancer  396 18 3.196177e-06
path:hsa04974            Protein digestion and absorption   89  8 5.235137e-06
path:hsa05010                         Alzheimer's disease  161 10 5.907093e-06
path:hsa04360                               Axon guidance  175 12 1.053315e-05
path:hsa04932   Non-alcoholic fatty liver disease (NAFLD)  146  9 1.398009e-05
path:hsa00230                           Purine metabolism  172 10 1.423313e-05
path:hsa05014         Amyotrophic lateral sclerosis (ALS)   51  6 3.195424e-05
path:hsa04064                NF-kappa B signaling pathway   92  7 3.245406e-05
path:hsa05164                                 Influenza A  161  9 4.380546e-05
path:hsa05030                           Cocaine addiction   49  6 4.428227e-05
path:hsa00240                       Pyrimidine metabolism  102  7 5.061418e-05
path:hsa04390                     Hippo signaling pathway  153 10 5.529910e-05
path:hsa05034                                  Alcoholism  174  9 6.894834e-05
                       FDR
path:hsa01100 3.477951e-21
path:hsa04310 7.747540e-08
path:hsa04650 4.762119e-06
path:hsa05031 1.036886e-05
path:hsa04141 3.464481e-05
path:hsa05166 3.464481e-05
path:hsa03013 8.553295e-05
path:hsa05200 1.210552e-04
path:hsa04974 1.762496e-04
path:hsa05010 1.789849e-04
path:hsa04360 2.901403e-04
path:hsa04932 3.317414e-04
path:hsa00230 3.317414e-04
path:hsa05014 6.555720e-04
path:hsa04064 6.555720e-04
path:hsa05164 7.892664e-04
path:hsa05030 7.892664e-04
path:hsa00240 8.520054e-04
path:hsa04390 8.818751e-04
path:hsa05034 1.044567e-03
>
>
>
>
>
> dev.off()
null device
          1
>
|