R: Computing test statistics for each row of a data frame
mt.teststat
R Documentation
Computing test statistics for each row of a data frame
Description
These functions provide a convenient way to compute test statistics,
e.g., two-sample Welch t-statistics, Wilcoxon statistics,
F-statistics, paired t-statistics,
block F-statistics, for each row of a data frame.
A data frame or matrix, with m rows corresponding to variables
(hypotheses) andn columns to observations. In the case of gene
expression data, rows
correspond to genes and columns to mRNA samples. The data can
be read using read.table.
classlabel
A vector of integers corresponding to observation (column)
class labels. For k classes, the labels must be integers
between 0 and k-1. For the blockf test option,
observations may be divided into
n/k blocks of k observations each. The observations are
ordered by block, and within each block, they are labeled using the
integers 0 to k-1.
test
A character string specifying the statistic to be
used to test the null hypothesis of no association between the
variables and the class labels.
If test="t", the tests are based on two-sample Welch t-statistics
(unequal variances).
If test="t.equalvar", the tests are based on two-sample
t-statistics with equal variance for the two samples. The
square of the t-statistic is equal to an F-statistic for k=2.
If test="wilcoxon", the tests are based on standardized rank sum Wilcoxon statistics.
If test="f", the tests are based on F-statistics.
If test="pairt", the tests are based on paired t-statistics. The
square of the paired t-statistic is equal to a block F-statistic for k=2.
If test="blockf", the tests are based on F-statistics which
adjust for block differences
(cf. two-way analysis of variance).
na
Code for missing values (the default is .mt.naNUM=--93074815.62).
Entries with missing values will be ignored in the computation,
i.e., test statistics will be based on a smaller sample size. This
feature has not yet fully implemented.
nonpara
If nonpara="y", nonparametric test statistics are computed based on ranked data.
If nonpara="n", the original data are used.
Value
For mt.teststat, a vector of test statistics for each row (gene).
For mt.teststat.num.denum, a data frame with
teststat.num
the numerator of the test statistics for each row, depending on the
specific test option.
teststat.denum
the denominator of the test statistics for each row, depending on the
specific test option.
# Gene expression data from Golub et al. (1999)
data(golub)
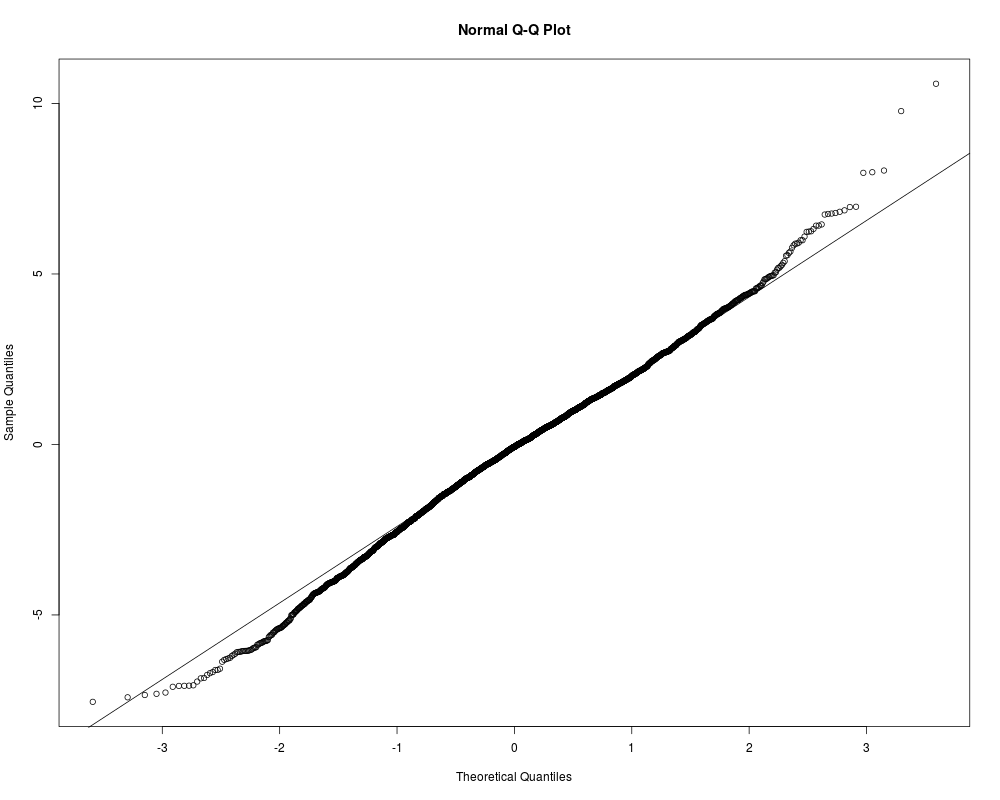
teststat<-mt.teststat(golub,golub.cl)
qqnorm(teststat)
qqline(teststat)
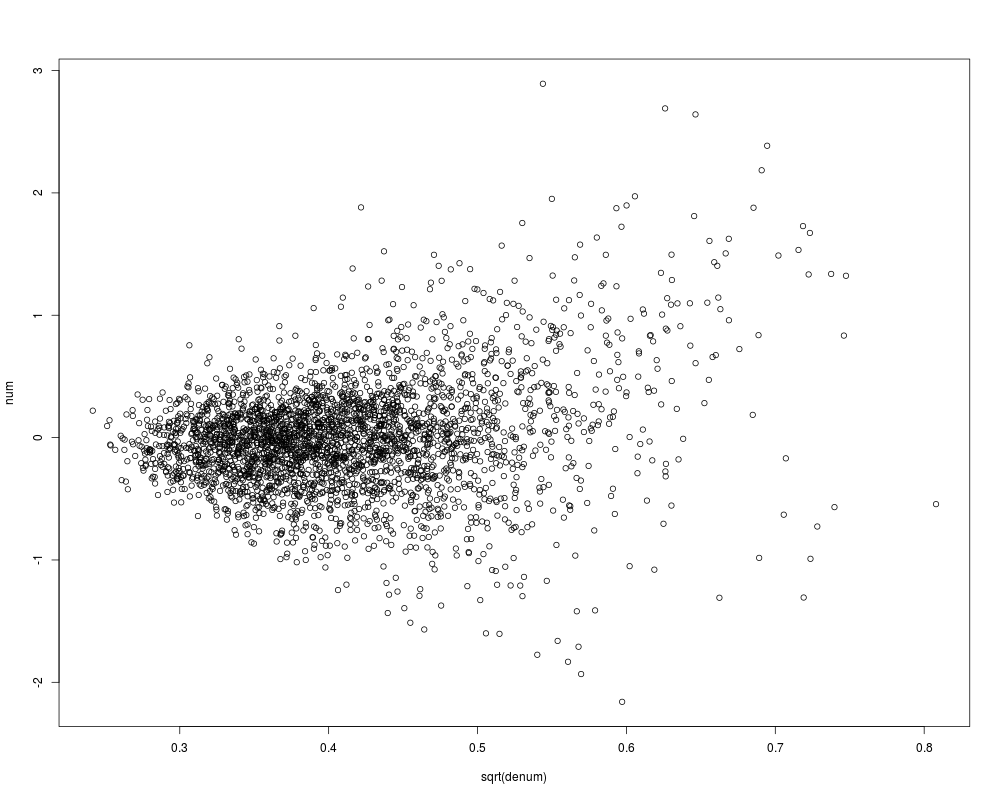
tmp<-mt.teststat.num.denum(golub,golub.cl,test="t")
num<-tmp$teststat.num
denum<-tmp$teststat.denum
plot(sqrt(denum),num)
tmp<-mt.teststat.num.denum(golub,golub.cl,test="f")
Results
R version 3.3.1 (2016-06-21) -- "Bug in Your Hair"
Copyright (C) 2016 The R Foundation for Statistical Computing
Platform: x86_64-pc-linux-gnu (64-bit)

R is free software and comes with ABSOLUTELY NO WARRANTY.
You are welcome to redistribute it under certain conditions.
Type 'license()' or 'licence()' for distribution details.

R is a collaborative project with many contributors.
Type 'contributors()' for more information and
'citation()' on how to cite R or R packages in publications.

Type 'demo()' for some demos, 'help()' for on-line help, or
'help.start()' for an HTML browser interface to help.
Type 'q()' to quit R.

> library(multtest)
Loading required package: BiocGenerics
Loading required package: parallel

Attaching package: 'BiocGenerics'

The following objects are masked from 'package:parallel':

    clusterApply, clusterApplyLB, clusterCall, clusterEvalQ,
    clusterExport, clusterMap, parApply, parCapply, parLapply,
    parLapplyLB, parRapply, parSapply, parSapplyLB

The following objects are masked from 'package:stats':

    IQR, mad, xtabs

The following objects are masked from 'package:base':

    Filter, Find, Map, Position, Reduce, anyDuplicated, append,
    as.data.frame, cbind, colnames, do.call, duplicated, eval, evalq,
    get, grep, grepl, intersect, is.unsorted, lapply, lengths, mapply,
    match, mget, order, paste, pmax, pmax.int, pmin, pmin.int, rank,
    rbind, rownames, sapply, setdiff, sort, table, tapply, union,
    unique, unsplit

Loading required package: Biobase
Welcome to Bioconductor

    Vignettes contain introductory material; view with
    'browseVignettes()'. To cite Bioconductor, see
    'citation("Biobase")', and for packages 'citation("pkgname")'.

> png(filename="/home/ddbj/snapshot/RGM3/R_BC/result/multtest/mt.teststat.Rd_%03d_medium.png", width=480, height=480)
> ### Name: mt.teststat
> ### Title: Computing test statistics for each row of a data frame
> ### Aliases: mt.teststat mt.teststat.num.denum
> ### Keywords: univar
>
> ### ** Examples
>
> # Gene expression data from Golub et al. (1999)
> data(golub)
>
> teststat<-mt.teststat(golub,golub.cl)
> qqnorm(teststat)
> qqline(teststat)
>
> tmp<-mt.teststat.num.denum(golub,golub.cl,test="t")
> num<-tmp$teststat.num
> denum<-tmp$teststat.denum
> plot(sqrt(denum),num)
>
> tmp<-mt.teststat.num.denum(golub,golub.cl,test="f")
>
>
>
>
>
>
> dev.off()
null device
          1
>
 .
.