R: Combines Strongly Connected Components into single nodes
SCCgraph
R Documentation
Combines Strongly Connected Components into single nodes
Description
SCCgraph is used to identify all nodes which are not distinguishable given the data.
Usage
SCCgraph(x,name=TRUE,nlength=20)
Arguments
x
graphNEL object or an adjacency matrix
name
Concatenate all names of summarized nodes, if TRUE, or number nodes, if FALSE. Default: TRUE
nlength
maximum length of names
Details
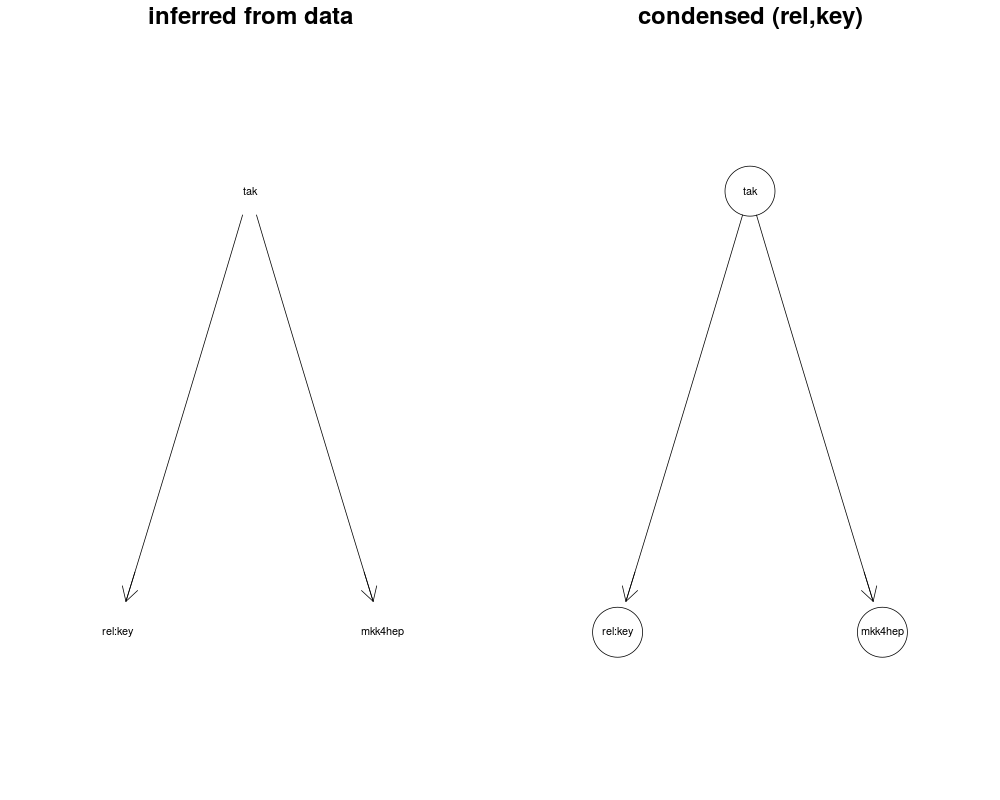
A graph inferred by either nem or nemModelSelection may have cycles if some phenotypic profiles are not distinguishable.
The function SCCgraph identifies cycles in the graph (the strongly conneced components) and summarizes them in a single node.
The resulting graph is then acyclic.
Value
graph
a graphNEL object with connected components of the input graph summarized into single nodes
scc
a list mapping SCCs to nodes
which.scc
a vector mapping nodes to SCCs
Author(s)
Florian Markowetz, Holger Froehlich
See Also
nem, transitive.reduction
Examples
   data("BoutrosRNAi2002")
   D   <- BoutrosRNAiDiscrete[,9:16]
   res <- nem(D,control=set.default.parameters(unique(colnames(D)), para=c(.13,.05)))
   #
   sccg <- SCCgraph(res$graph,name=TRUE)
   #
   par(mfrow=c(1,2))
   if(require(Rgraphviz)){
    plot.nem(res, main="inferred from data")
    plot(sccg$graph, main="condensed (rel,key)")
    }
Results
R version 3.3.1 (2016-06-21) -- "Bug in Your Hair"
Copyright (C) 2016 The R Foundation for Statistical Computing
Platform: x86_64-pc-linux-gnu (64-bit)

R is free software and comes with ABSOLUTELY NO WARRANTY.
You are welcome to redistribute it under certain conditions.
Type 'license()' or 'licence()' for distribution details.

R is a collaborative project with many contributors.
Type 'contributors()' for more information and
'citation()' on how to cite R or R packages in publications.

Type 'demo()' for some demos, 'help()' for on-line help, or
'help.start()' for an HTML browser interface to help.
Type 'q()' to quit R.

> library(nem)
> png(filename="/home/ddbj/snapshot/RGM3/R_BC/result/nem/SCCgraph.Rd_%03d_medium.png", width=480, height=480)
> ### Name: SCCgraph
> ### Title: Combines Strongly Connected Components into single nodes
> ### Aliases: SCCgraph
> ### Keywords: graphs
>
> ### ** Examples
>
>    data("BoutrosRNAi2002")
>    D   <- BoutrosRNAiDiscrete[,9:16]
>    res <- nem(D,control=set.default.parameters(unique(colnames(D)), para=c(.13,.05)))
Greedy hillclimber for 4 S-genes (lambda = 0 )...

>    #
>    sccg <- SCCgraph(res$graph,name=TRUE)
>    #
>    par(mfrow=c(1,2))
>    if(require(Rgraphviz)){
+     plot.nem(res, main="inferred from data")
+     plot(sccg$graph, main="condensed (rel,key)")
+     }
Loading required package: Rgraphviz
Loading required package: graph
Loading required package: BiocGenerics
Loading required package: parallel

Attaching package: 'BiocGenerics'

The following objects are masked from 'package:parallel':

    clusterApply, clusterApplyLB, clusterCall, clusterEvalQ,
    clusterExport, clusterMap, parApply, parCapply, parLapply,
    parLapplyLB, parRapply, parSapply, parSapplyLB

The following objects are masked from 'package:stats':

    IQR, mad, xtabs

The following objects are masked from 'package:base':

    Filter, Find, Map, Position, Reduce, anyDuplicated, append,
    as.data.frame, cbind, colnames, do.call, duplicated, eval, evalq,
    get, grep, grepl, intersect, is.unsorted, lapply, lengths, mapply,
    match, mget, order, paste, pmax, pmax.int, pmin, pmin.int, rank,
    rbind, rownames, sapply, setdiff, sort, table, tapply, union,
    unique, unsplit

Loading required package: grid
>
>
>
>
>
> dev.off()
null device
          1
>
 .
.