Supported by Dr. Osamu Ogasawara and  . . |
|
Last data update: 2014.03.03 |
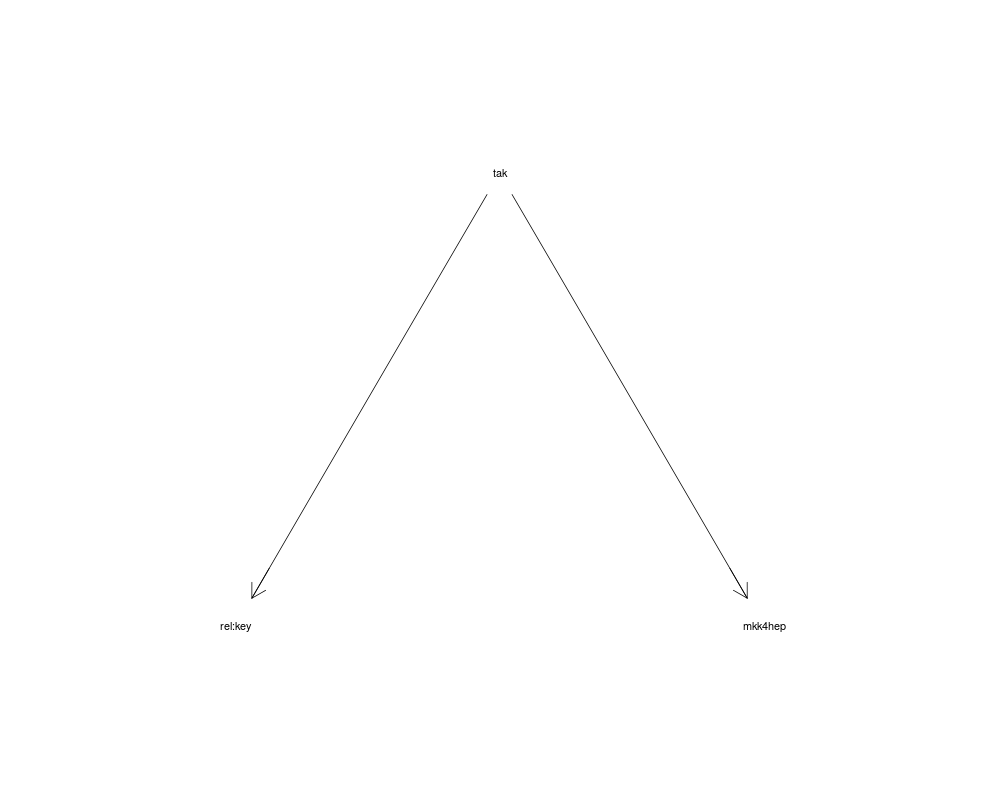
Infer regulation direction for each edgeDescriptionThe method infers edge types (up-regulation, down-regulation) for a given nem model. Direct approach: For an edge a->b the method looks, whether b is up- or down-regulated in a knock-down of a. Indirect approach: For an edge a->b the method looks at the fraction of E-genes attached to b (including b itself), which are up- or down-regulated in a knock-down of a. If significantly more genes are down-regulated than up-regulated, the edge a->b is assumed to be an activation. Likewise, if significantly more genes are up-regulated than down-regulated, a->b is assumed to be an inhibition. If there is no significant difference in up- and down-regulated edges, a->b does not have a specified type. Usage
infer.edge.type(x, logFC, alpha=0.05, adj.method="BY", method=c("direct", "indirect"))
Arguments
DetailsSignificance in case of the indirect method is calculated using a two-tailed binomial test with null hypothesis p=0.5. ValueModified nem object. Each edge in the nem graph now has a "weight" and a "label" attribute. The label attribute corresponds to the original value in the adjacency matrix. The weight attribute encodes up- and down-regulation in the following way: value 2 means up-regulation, value -1 down-regulation and value 1 an unknown effect. Author(s)Holger Froehlich See Also
Examples
   	data("BoutrosRNAi2002")
	D <- BoutrosRNAiDiscrete[,9:16]
	result = nem(D, control=set.default.parameters(unique(colnames(D)), para=c(0.13,0.05)))
   	resEdgeInf = infer.edge.type(result, BoutrosRNAiLogFC)
  if(require(Rgraphviz))
   	plot.nem(resEdgeInf)
Results
R version 3.3.1 (2016-06-21) -- "Bug in Your Hair"
Copyright (C) 2016 The R Foundation for Statistical Computing
Platform: x86_64-pc-linux-gnu (64-bit)

R is free software and comes with ABSOLUTELY NO WARRANTY.
You are welcome to redistribute it under certain conditions.
Type 'license()' or 'licence()' for distribution details.

R is a collaborative project with many contributors.
Type 'contributors()' for more information and
'citation()' on how to cite R or R packages in publications.

Type 'demo()' for some demos, 'help()' for on-line help, or
'help.start()' for an HTML browser interface to help.
Type 'q()' to quit R.

> library(nem)
> png(filename="/home/ddbj/snapshot/RGM3/R_BC/result/nem/infer.edge.type.Rd_%03d_medium.png", width=480, height=480)
> ### Name: infer.edge.type
> ### Title: Infer regulation direction for each edge
> ### Aliases: infer.edge.type
> ### Keywords: models
>
> ### ** Examples
>
>    	data("BoutrosRNAi2002")
> 	D <- BoutrosRNAiDiscrete[,9:16]
> 	result = nem(D, control=set.default.parameters(unique(colnames(D)), para=c(0.13,0.05)))
Greedy hillclimber for 4 S-genes (lambda = 0 )...

>    	resEdgeInf = infer.edge.type(result, BoutrosRNAiLogFC)
>   if(require(Rgraphviz))
+    	plot.nem(resEdgeInf)
Loading required package: Rgraphviz
Loading required package: graph
Loading required package: BiocGenerics
Loading required package: parallel

Attaching package: 'BiocGenerics'

The following objects are masked from 'package:parallel':

    clusterApply, clusterApplyLB, clusterCall, clusterEvalQ,
    clusterExport, clusterMap, parApply, parCapply, parLapply,
    parLapplyLB, parRapply, parSapply, parSapplyLB

The following objects are masked from 'package:stats':

    IQR, mad, xtabs

The following objects are masked from 'package:base':

    Filter, Find, Map, Position, Reduce, anyDuplicated, append,
    as.data.frame, cbind, colnames, do.call, duplicated, eval, evalq,
    get, grep, grepl, intersect, is.unsorted, lapply, lengths, mapply,
    match, mget, order, paste, pmax, pmax.int, pmin, pmin.int, rank,
    rbind, rownames, sapply, setdiff, sort, table, tapply, union,
    unique, unsplit

Loading required package: grid
>
>
>
>
>
> dev.off()
null device
          1
>
|