Supported by Dr. Osamu Ogasawara and  . . |
|
Last data update: 2014.03.03 |
Nested Effects Models - main functionDescriptionThe main function to perform model learning from data Usagenem(D,inference="nem.greedy",models=NULL,control=set.default.parameters(setdiff(unique(colnames(D)),"time")), verbose=FALSE) ## S3 method for class 'nem' print(x, ...) Arguments
DetailsIf parameter Pm != NULL and parameter lambda == 0, a Bayesian approach to include prior knowledge is used. Alternatively, the regularization parameter lambda can be tuned in a model selection step via the function The function Value
For inference = "mc.eminem" the following additional values are returned:
Author(s)Holger Froehlich, Florian Markowetz ReferencesMarkowetz, F.; Bloch, J. & Spang, R., Non-transcriptional Pathway Features Reconstructed from Secondary Effects of RNA interference. Bioinformatics, 2005, 21, 4026 - 4032 Markowetz, F.; Kostka, D.; Troyanskaya, O. & Spang, R., Nested Effects Models for High-dimensional Phenotyping Screens. Bioinformatics, 2007, 23, i305 - i312 Fr"ohlich, H.; Fellmann, M.; S"ultmann, H.; Poustka, A. & Beissbarth, T. Large Scale Statistical Inference of Signaling Pathways from RNAi and Microarray Data. BMC Bioinformatics, 2007, 8, 386 Fr"ohlich, H.; Fellmann, M.; S"ultmann, H.; Poustka, A. & Beissbarth, T. Estimating Large Scale Signaling Networks through Nested Effect Models with Intervention Effects from Microarray Data. Bioinformatics, 2008, 24, 2650-2656 Tresch, A. & Markowetz, F., Structure Learning in Nested Effects Models Statistical Applications in Genetics and Molecular Biology, 2008, 7 Zeller, C.; Fr"ohlich, H. & Tresch, A., A Bayesian Network View on Nested Effects Models EURASIP Journal on Bioinformatics and Systems Biology, 2009, 195272 Fr"ohlich, H.; Tresch, A. & Beissbarth, T., Nested Effects Models for Learning Signaling Networks from Perturbation Data. Biometrical Journal, 2009, 2, 304 - 323 Fr"ohlich, H.; Sahin, "O.; Arlt, D.; Bender, C. & Beissbarth, T. Deterministic Effects Propagation Networks for Reconstructing Protein Signaling Networks from Multiple Interventions. BMC Bioinformatics, 2009, 10, 322 Fr"ohlich, H.; Praveen, P. & Tresch, A., Fast and Efficient Dynamic Nested Effects Models. Bioinformatics, 2011, 27, 238-244 Niederberger, T.; Etzold, S.; Lidschreiber, M; Maier, K.; Martin, D.; Fr"ohlich, H.; Cramer, P.; Tresch, A., MC Eminem Maps the Interaction Landscape of the Mediator, PLoS Comp. Biol., 8(6): e1002568, 2012. See Also
Examples
data("BoutrosRNAi2002")
D <- BoutrosRNAiDiscrete[,9:16]
control = set.default.parameters(unique(colnames(D)), para=c(0.13, 0.05))
res1 <- nem(D,inference="search", control=control)
res2 <- nem(D,inference="pairwise", control=control)
res3 <- nem(D,inference="triples", control=control)
res4 <- nem(D,inference="ModuleNetwork", control=control)
res5 <- nem(D,inference="nem.greedy", control=control)
res6 = nem(BoutrosRNAiLods, inference="nem.greedyMAP", control=control)
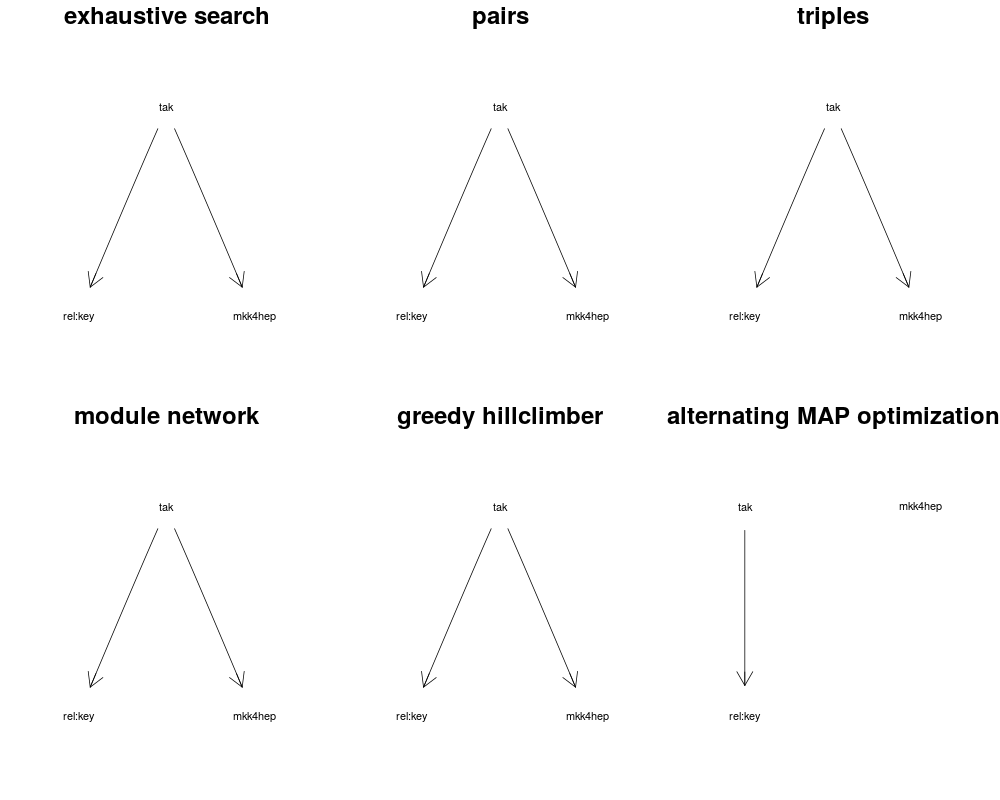
par(mfrow=c(2,3))
plot.nem(res1,main="exhaustive search")
plot.nem(res2,main="pairs")
plot.nem(res3,main="triples")
plot.nem(res4,main="module network")
plot.nem(res5,main="greedy hillclimber")
plot.nem(res6,main="alternating MAP optimization")
Results
R version 3.3.1 (2016-06-21) -- "Bug in Your Hair"
Copyright (C) 2016 The R Foundation for Statistical Computing
Platform: x86_64-pc-linux-gnu (64-bit)

R is free software and comes with ABSOLUTELY NO WARRANTY.
You are welcome to redistribute it under certain conditions.
Type 'license()' or 'licence()' for distribution details.

R is a collaborative project with many contributors.
Type 'contributors()' for more information and
'citation()' on how to cite R or R packages in publications.

Type 'demo()' for some demos, 'help()' for on-line help, or
'help.start()' for an HTML browser interface to help.
Type 'q()' to quit R.

> library(nem)
> png(filename="/home/ddbj/snapshot/RGM3/R_BC/result/nem/nem.Rd_%03d_medium.png", width=480, height=480)
> ### Name: nem
> ### Title: Nested Effects Models - main function
> ### Aliases: nem print.nem print.nem.greedy print.nem.greedyMAP
> ###   print.pairwise print.triples print.ModuleNetwork print.score
> ###   print.nem.BN print.mc.eminem print.dynoNEM
> ### Keywords: graphs models
>
> ### ** Examples
>
>    data("BoutrosRNAi2002")
>    D <- BoutrosRNAiDiscrete[,9:16]
>    control = set.default.parameters(unique(colnames(D)), para=c(0.13, 0.05))
>    res1 <- nem(D,inference="search", control=control)
>    res2 <- nem(D,inference="pairwise", control=control)
>    res3 <- nem(D,inference="triples", control=control)
4 perturbed genes -> 4 triples to check (lambda =  0 )
>    res4 <- nem(D,inference="ModuleNetwork", control=control)
Estimating module network of 4 S-genes (lambda = 0 )...

>    res5 <- nem(D,inference="nem.greedy", control=control)
Greedy hillclimber for 4 S-genes (lambda = 0 )...

>    res6 = nem(BoutrosRNAiLods, inference="nem.greedyMAP", control=control)
Alternating optimization for 4 S-genes (lambda = 0 )...

>
>
>    par(mfrow=c(2,3))
>    plot.nem(res1,main="exhaustive search")
>    plot.nem(res2,main="pairs")
>    plot.nem(res3,main="triples")
>    plot.nem(res4,main="module network")
>    plot.nem(res5,main="greedy hillclimber")
>    plot.nem(res6,main="alternating MAP optimization")
>
>
>
>
>
> dev.off()
null device
          1
>
|