Supported by Dr. Osamu Ogasawara and  . . |
|
Last data update: 2014.03.03 |
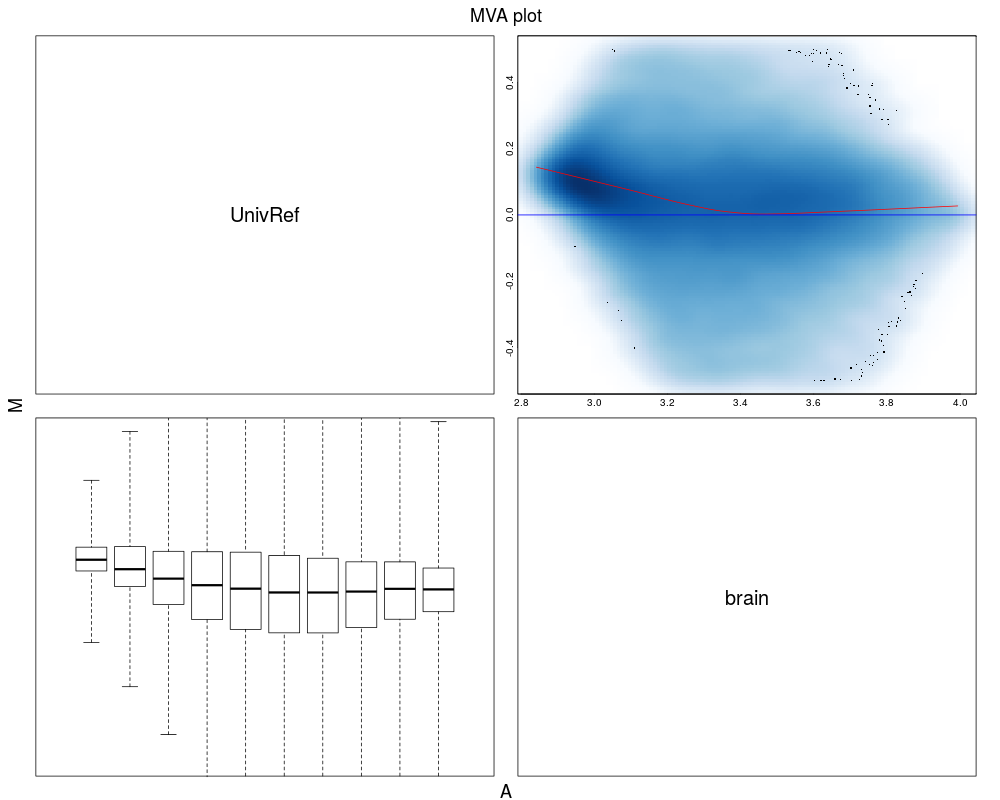
MA plotsDescriptionCreate MA plots using a reference array (if one channel) or using channel2 as reference (if two channel). Usage
MAplot(object, ...)

## S4 method for signature 'FeatureSet'
MAplot(object, what=pm, transfo=log2, groups,
       refSamples, which, pch=".", summaryFun=rowMedians,
       plotFun=smoothScatter, main="vs pseudo-median reference chip",
       pairs=FALSE, ...)

## S4 method for signature 'TilingFeatureSet'
MAplot(object, what=pm, transfo=log2, groups,
       refSamples, which, pch=".", summaryFun=rowMedians,
       plotFun=smoothScatter, main="vs pseudo-median reference chip",
       pairs=FALSE, ...)

## S4 method for signature 'PLMset'
MAplot(object, what=coefs, transfo=identity, groups,
       refSamples, which, pch=".", summaryFun=rowMedians,
       plotFun=smoothScatter, main="vs pseudo-median reference chip",
       pairs=FALSE, ...)

## S4 method for signature 'matrix'
MAplot(object, what=identity, transfo=identity,
       groups, refSamples, which, pch=".", summaryFun=rowMedians,
       plotFun=smoothScatter, main="vs pseudo-median reference chip",
       pairs=FALSE, ...)

## S4 method for signature 'ExpressionSet'
MAplot(object, what=exprs, transfo=identity,
       groups, refSamples, which, pch=".", summaryFun=rowMedians,
       plotFun=smoothScatter, main="vs pseudo-median reference chip",
       pairs=FALSE, ...)
Arguments
DetailsMAplot will take the following extra arguments:
ValuePlot Author(s)Benilton Carvalho - based on Ben Bolstad's original MAplot function. See Also
Examples
if(require(oligoData) & require(pd.hg18.60mer.expr)){
  data(nimbleExpressionFS)
  nimbleExpressionFS
  groups <- factor(rep(c('brain', 'UnivRef'), each=3))
  data.frame(sampleNames(nimbleExpressionFS), groups)
  MAplot(nimbleExpressionFS, pairs=TRUE, ylim=c(-.5, .5), groups=groups)
}
Results
R version 3.3.1 (2016-06-21) -- "Bug in Your Hair"
Copyright (C) 2016 The R Foundation for Statistical Computing
Platform: x86_64-pc-linux-gnu (64-bit)

R is free software and comes with ABSOLUTELY NO WARRANTY.
You are welcome to redistribute it under certain conditions.
Type 'license()' or 'licence()' for distribution details.

R is a collaborative project with many contributors.
Type 'contributors()' for more information and
'citation()' on how to cite R or R packages in publications.

Type 'demo()' for some demos, 'help()' for on-line help, or
'help.start()' for an HTML browser interface to help.
Type 'q()' to quit R.

> library(oligo)
Loading required package: BiocGenerics
Loading required package: parallel

Attaching package: 'BiocGenerics'

The following objects are masked from 'package:parallel':

    clusterApply, clusterApplyLB, clusterCall, clusterEvalQ,
    clusterExport, clusterMap, parApply, parCapply, parLapply,
    parLapplyLB, parRapply, parSapply, parSapplyLB

The following objects are masked from 'package:stats':

    IQR, mad, xtabs

The following objects are masked from 'package:base':

    Filter, Find, Map, Position, Reduce, anyDuplicated, append,
    as.data.frame, cbind, colnames, do.call, duplicated, eval, evalq,
    get, grep, grepl, intersect, is.unsorted, lapply, lengths, mapply,
    match, mget, order, paste, pmax, pmax.int, pmin, pmin.int, rank,
    rbind, rownames, sapply, setdiff, sort, table, tapply, union,
    unique, unsplit

Loading required package: oligoClasses
Welcome to oligoClasses version 1.34.0
Loading required package: Biobase
Welcome to Bioconductor

    Vignettes contain introductory material; view with
    'browseVignettes()'. To cite Bioconductor, see
    'citation("Biobase")', and for packages 'citation("pkgname")'.

Loading required package: Biostrings
Loading required package: S4Vectors
Loading required package: stats4

Attaching package: 'S4Vectors'

The following objects are masked from 'package:base':

    colMeans, colSums, expand.grid, rowMeans, rowSums

Loading required package: IRanges
Loading required package: XVector
================================================================================
Welcome to oligo version 1.36.1
================================================================================
> png(filename="/home/ddbj/snapshot/RGM3/R_BC/result/oligo/MAplot-methods.Rd_%03d_medium.png", width=480, height=480)
> ### Name: MAplot
> ### Title: MA plots
> ### Aliases: MAplot MAplot-methods MAplot,FeatureSet-method
> ###   MAplot,TilingFeatureSet-method MAplot,PLMset-method
> ###   MAplot,ExpressionSet-method MAplot,matrix-method
> ### Keywords: methods hplot smooth loess
>
> ### ** Examples
>
> if(require(oligoData) & require(pd.hg18.60mer.expr)){
+   data(nimbleExpressionFS)
+   nimbleExpressionFS
+   groups <- factor(rep(c('brain', 'UnivRef'), each=3))
+   data.frame(sampleNames(nimbleExpressionFS), groups)
+   MAplot(nimbleExpressionFS, pairs=TRUE, ylim=c(-.5, .5), groups=groups)
+ }
Loading required package: oligoData
Loading required package: pd.hg18.60mer.expr
Loading required package: RSQLite
Loading required package: DBI
>
>
>
>
>
>
> dev.off()
null device
          1
>
|