Supported by Dr. Osamu Ogasawara and  . . |
|
Last data update: 2014.03.03 |
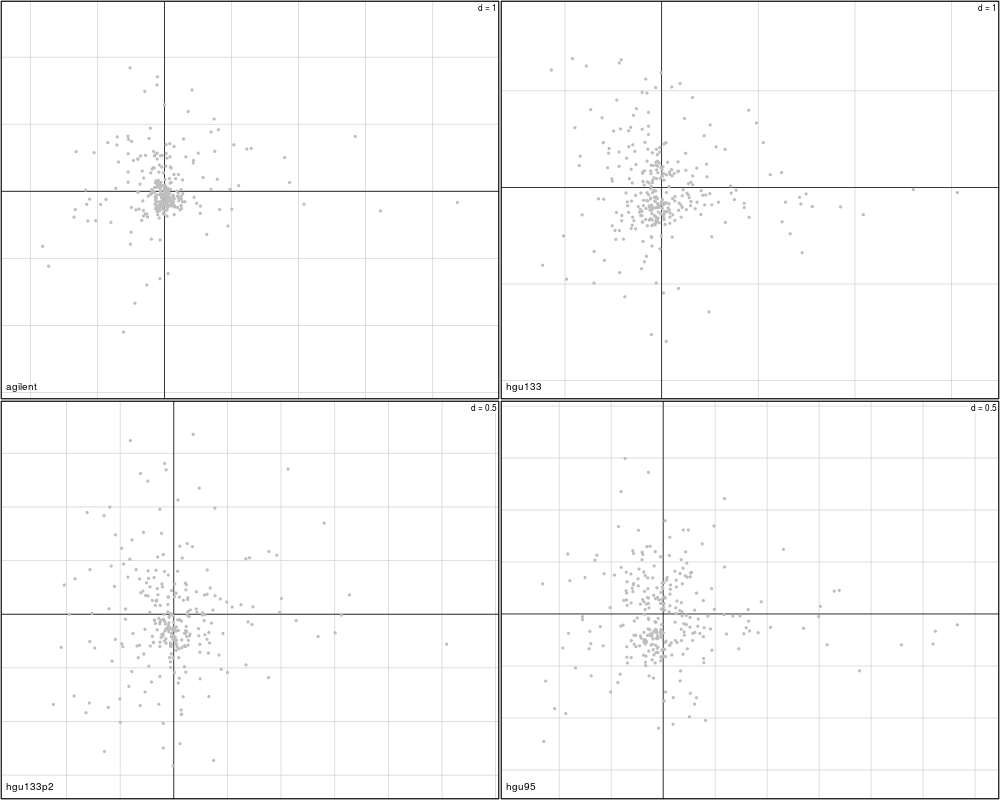
Plot variable (gene) spaces of result from MCIA or CIADescriptionThe user level function for plotting variable space of Usage
  plotVar(x, var = NA, axes = 1:2,
          var.col = "red", var.lab = FALSE, bg.var.col = "gray",
          nlab = 0, sepID.data=NULL, sepID.sep="_", ...)
Arguments
DetailsFor the sepID.data, a typical example is the post-transcriptional modification (PTM) data.
The name of variables (genes) have a general form like
"proteinName_modificationSite". The ValueIf Author(s)Chen Meng See AlsoSee Also as Examples
data(NCI60_4arrays)
mcoin <- mcia(NCI60_4arrays)
plotVar(mcoin, var=c("S100B", "S100A1"), var.lab=TRUE)
# an example for the usage of sepID.data and sepID.sep
nci60_mod <- NCI60_4arrays
rownames(nci60_mod$hgu95) <- paste(rownames(nci60_mod$hgu95), "s1", sep="_")
mcoin_mod <- mcia(nci60_mod)
# without specifying
plotVar(mcoin_mod, var=c("S100B", "S100A1"), var.lab=TRUE)
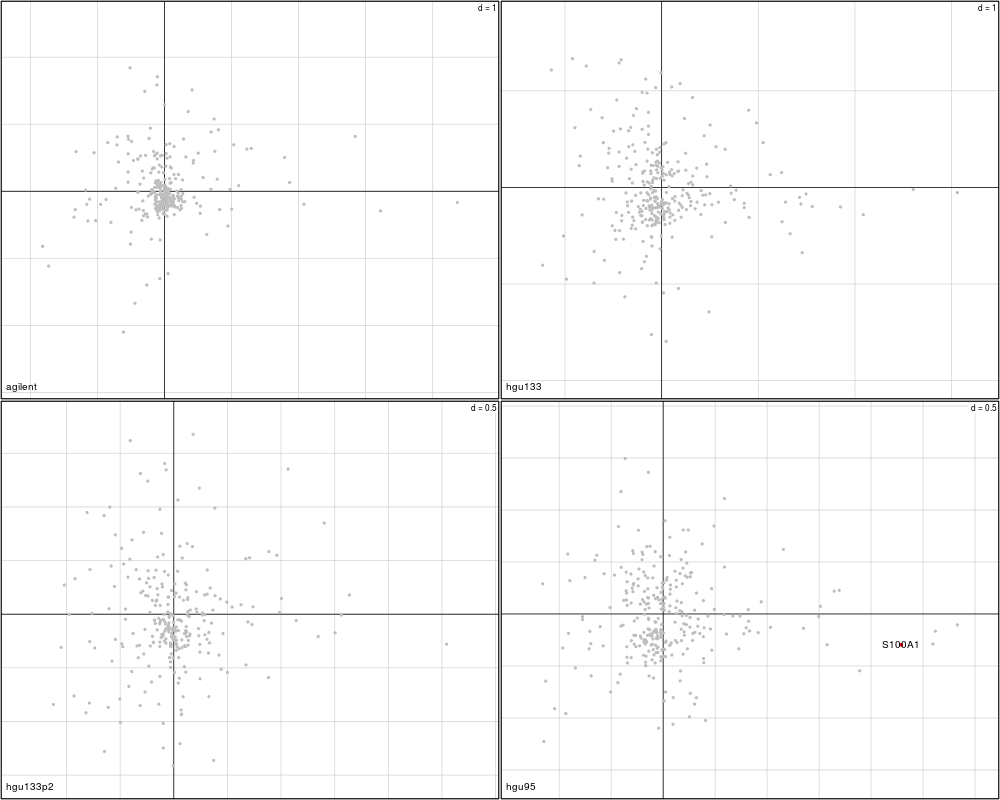
# specifying the sepID.data and sepID.sep
plotVar(mcoin_mod, var=c("S100B", "S100A1"), var.lab=TRUE, sepID.data=4, sepID.sep="_")
Results
R version 3.3.1 (2016-06-21) -- "Bug in Your Hair"
Copyright (C) 2016 The R Foundation for Statistical Computing
Platform: x86_64-pc-linux-gnu (64-bit)

R is free software and comes with ABSOLUTELY NO WARRANTY.
You are welcome to redistribute it under certain conditions.
Type 'license()' or 'licence()' for distribution details.

R is a collaborative project with many contributors.
Type 'contributors()' for more information and
'citation()' on how to cite R or R packages in publications.

Type 'demo()' for some demos, 'help()' for on-line help, or
'help.start()' for an HTML browser interface to help.
Type 'q()' to quit R.

> library(omicade4)
Loading required package: ade4
> png(filename="/home/ddbj/snapshot/RGM3/R_BC/result/omicade4/plotVar.Rd_%03d_medium.png", width=480, height=480)
> ### Name: plotVar
> ### Title: Plot variable (gene) spaces of result from MCIA or CIA
> ### Aliases: plotVar
>
> ### ** Examples
>
>
> data(NCI60_4arrays)
> mcoin <- mcia(NCI60_4arrays)
> plotVar(mcoin, var=c("S100B", "S100A1"), var.lab=TRUE)
  Variables agilent hgu133 hgu133p2 hgu95
1     S100B   FALSE  FALSE    FALSE FALSE
2    S100A1   FALSE  FALSE    FALSE FALSE
>
> # an example for the usage of sepID.data and sepID.sep
> nci60_mod <- NCI60_4arrays
> rownames(nci60_mod$hgu95) <- paste(rownames(nci60_mod$hgu95), "s1", sep="_")
> mcoin_mod <- mcia(nci60_mod)
> # without specifying
> plotVar(mcoin_mod, var=c("S100B", "S100A1"), var.lab=TRUE)
  Variables agilent hgu133 hgu133p2 hgu95
1     S100B   FALSE  FALSE    FALSE FALSE
2    S100A1   FALSE  FALSE    FALSE FALSE
> # specifying the sepID.data and sepID.sep
> plotVar(mcoin_mod, var=c("S100B", "S100A1"), var.lab=TRUE, sepID.data=4, sepID.sep="_")
  Variables agilent hgu133 hgu133p2 hgu95
1     S100B   FALSE  FALSE    FALSE FALSE
2    S100A1   FALSE  FALSE    FALSE  TRUE
>
>
>
>
>
>
> dev.off()
null device
          1
>
|