Supported by Dr. Osamu Ogasawara and  . . |
|
Last data update: 2014.03.03 |
Class
|
x |
An instance of class |
methods |
Dimensionality reduction methods to be used to
visualise the data. Must be contained in |
dims |
A list of numerics defining dimensions used for
plotting. Default are |
methargs |
A list of additional arguments to be passed for each
visualisation method. If provided, the length of this list must be
identical to the length of |
... |
Additional arguments. Currently ignored. |
Slots
vismats:A
"list"of matrices containing the feature projections in 2 dimensions.data:The original spatial proteomics data stored as an
"MSnSet".methargs:A
"list"of additional plotting arguments.objname:A
"character"defining how to name the dataset. By default, this is set using the variable name used at object creation.
Methods
plot:Generates the figures for the respective
methodsand additional arguments defined in the constructor. If used in an interactive session, the user is prompted to press 'Return' before new figures are displayed.show:A simple textual summary of the object.
Author(s)
Laurent Gatto <lg390@cam.ac.uk>
See Also
The data for the individual visualisations is created by
plot2D.
Examples
library("pRolocdata")
data(dunkley2006)
## Default parameters for a set of methods
## (in the interest of time, don't use t-SNE)
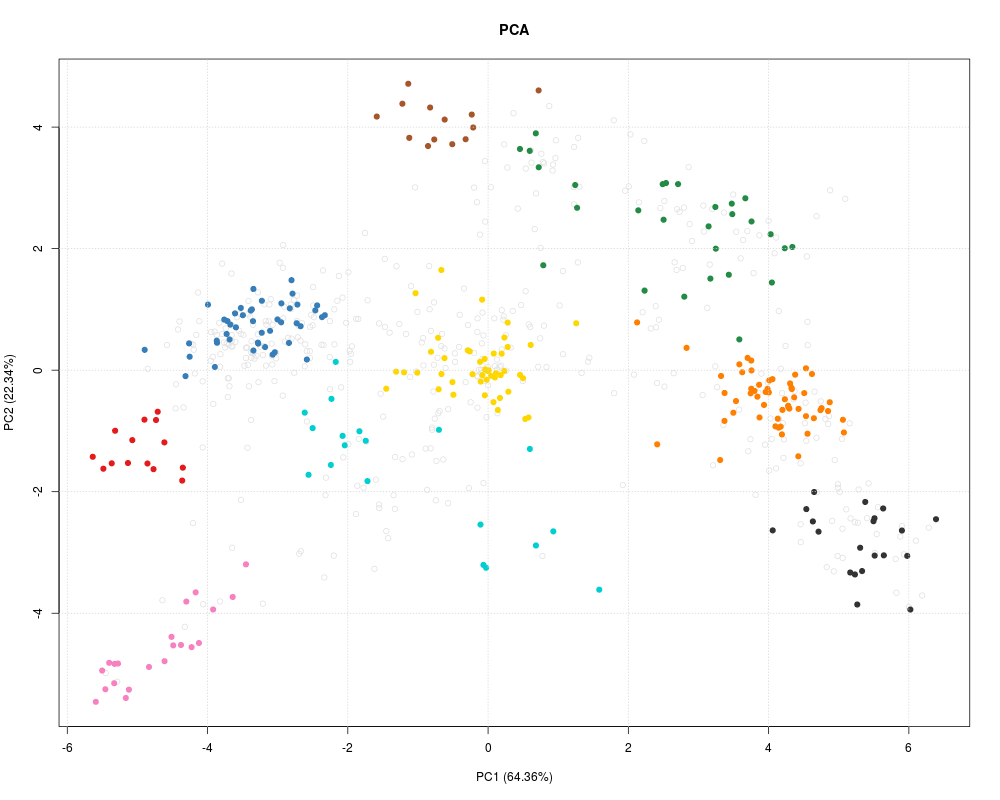
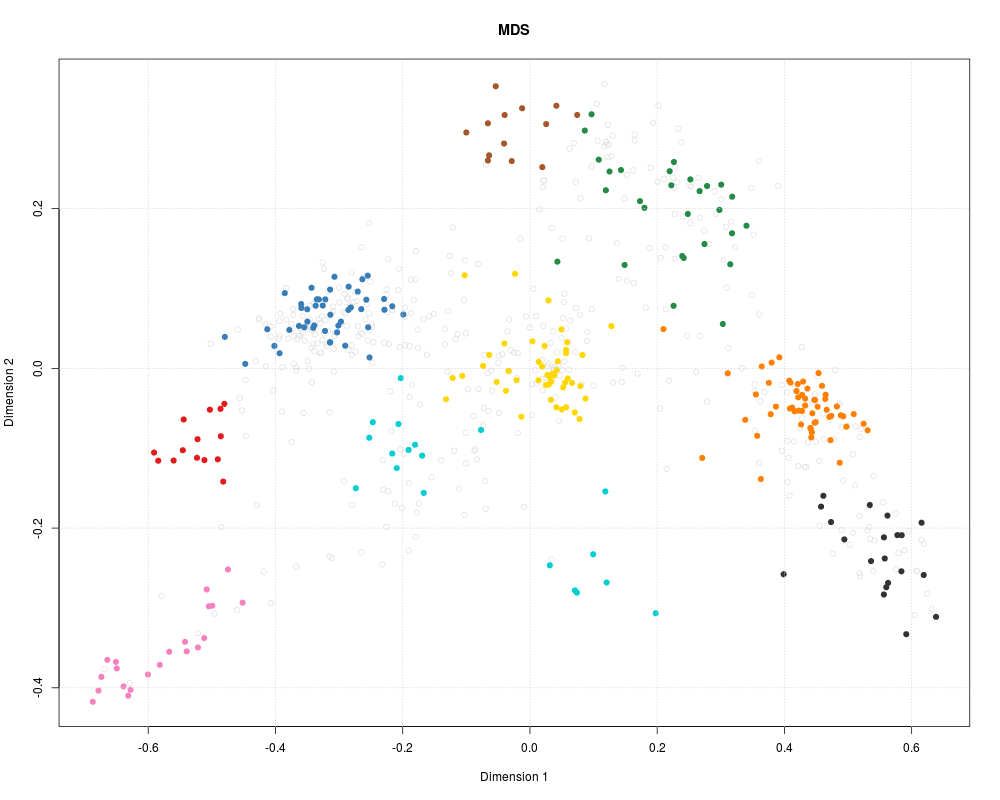
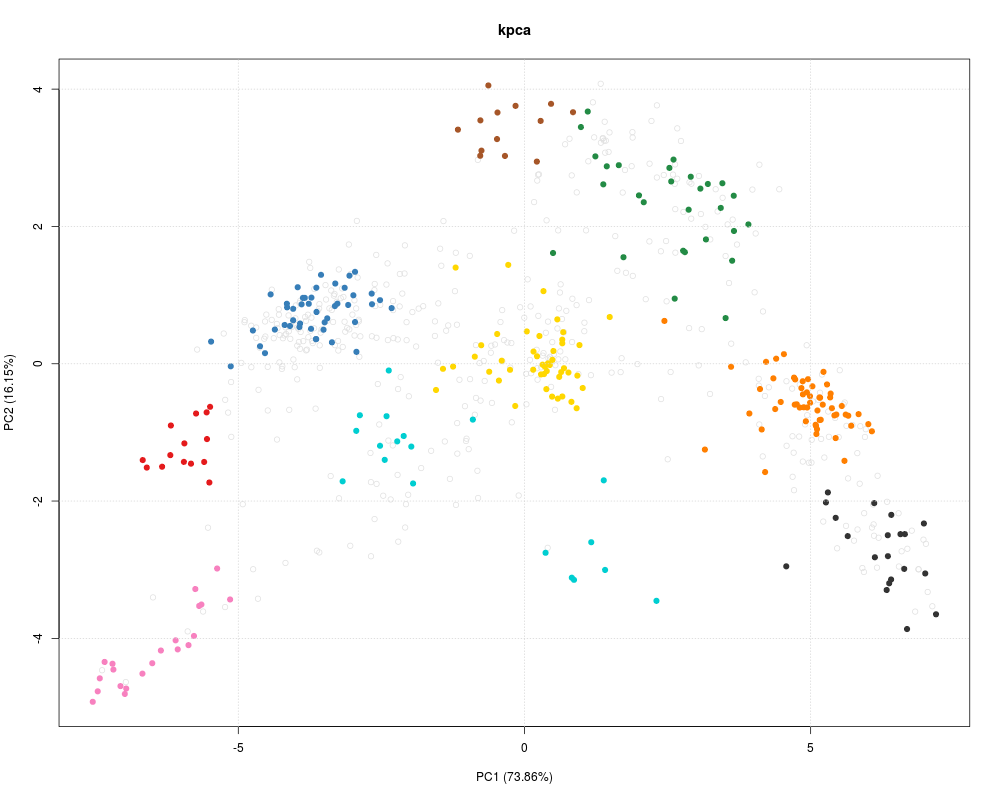
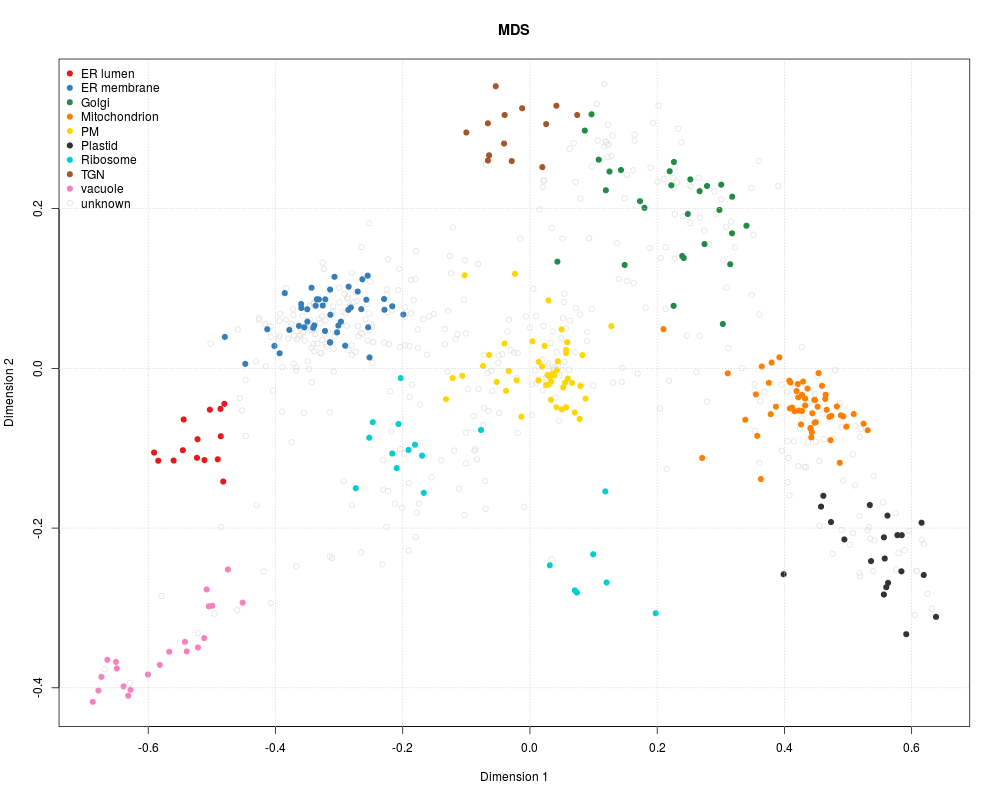
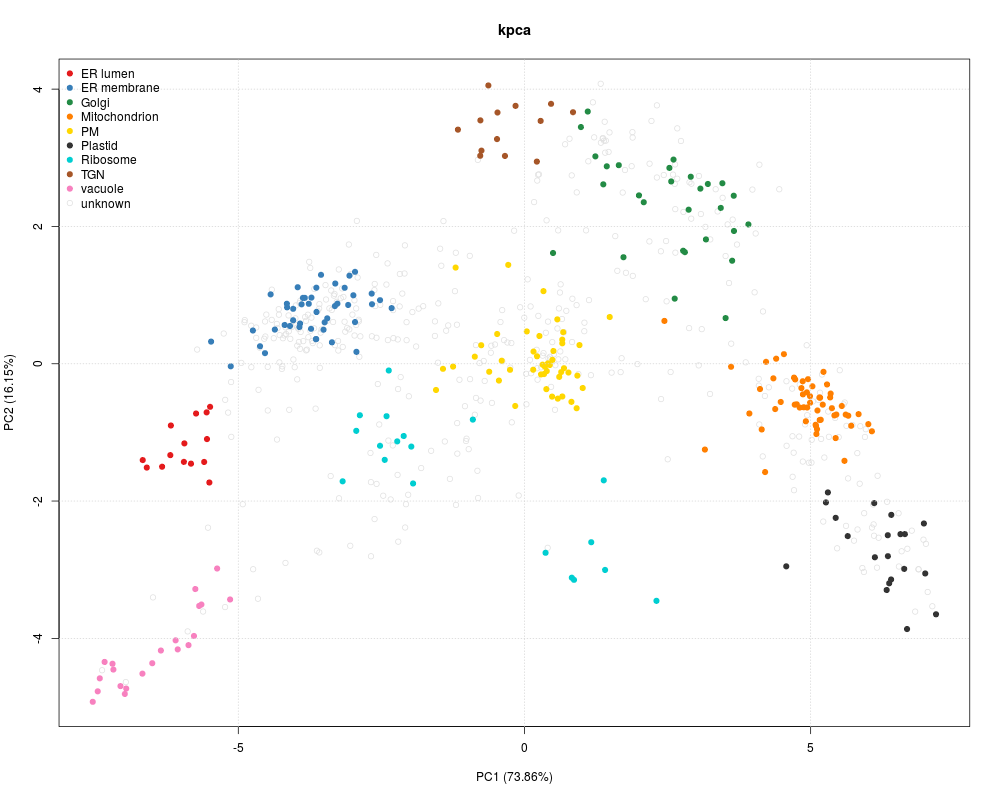
m <- c("PCA", "MDS", "kpca")
vis <- SpatProtVis(dunkley2006, methods = m)
vis
plot(vis)
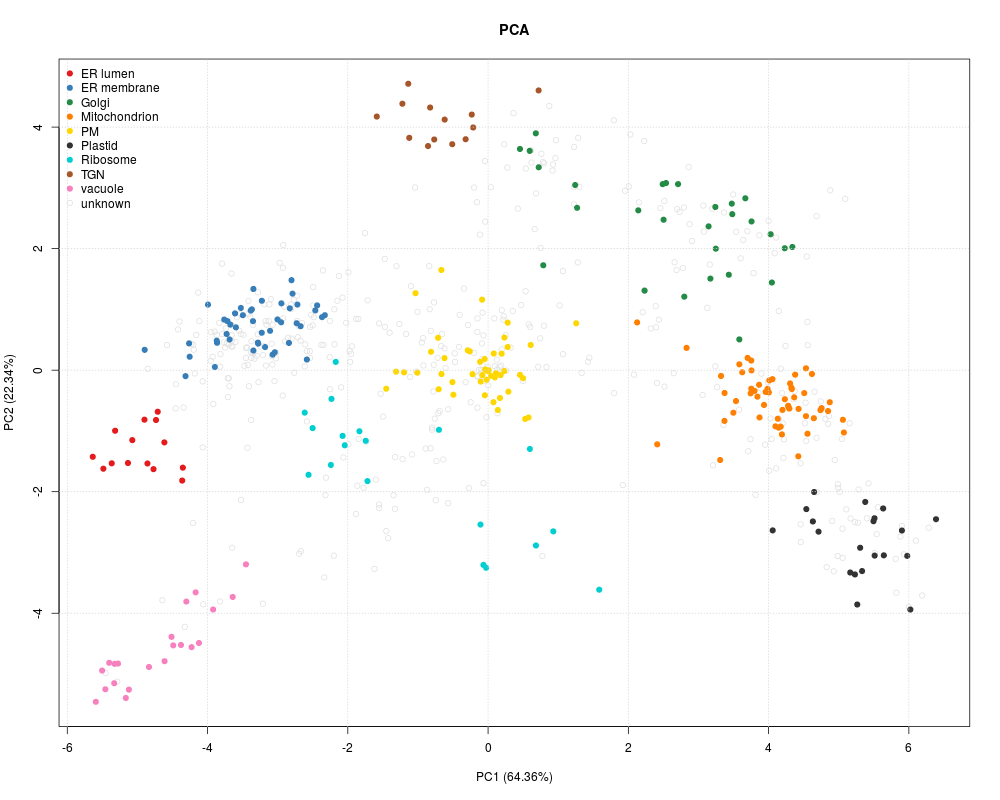
plot(vis, legend = "topleft")
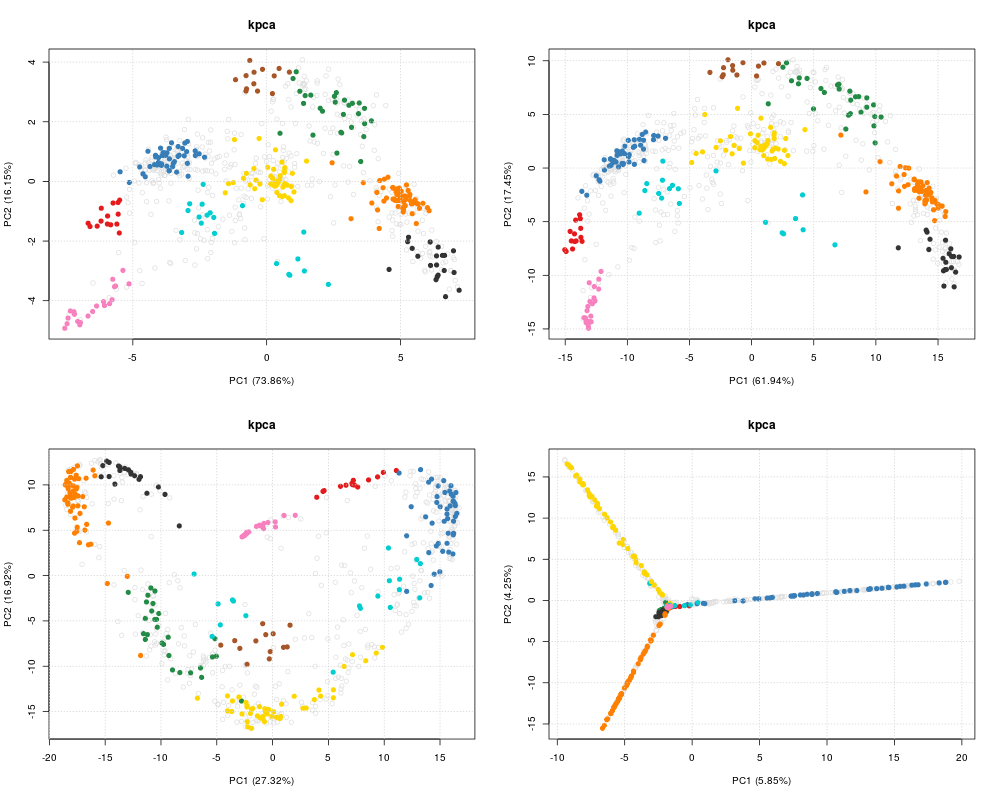
## Setting method arguments
margs <- c(list(kpar = list(sigma = 0.1)),
list(kpar = list(sigma = 1.0)),
list(kpar = list(sigma = 10)),
list(kpar = list(sigma = 100)))
vis <- SpatProtVis(dunkley2006,
methods = rep("kpca", 4),
methargs = margs)
par(mfrow = c(2, 2))
plot(vis)
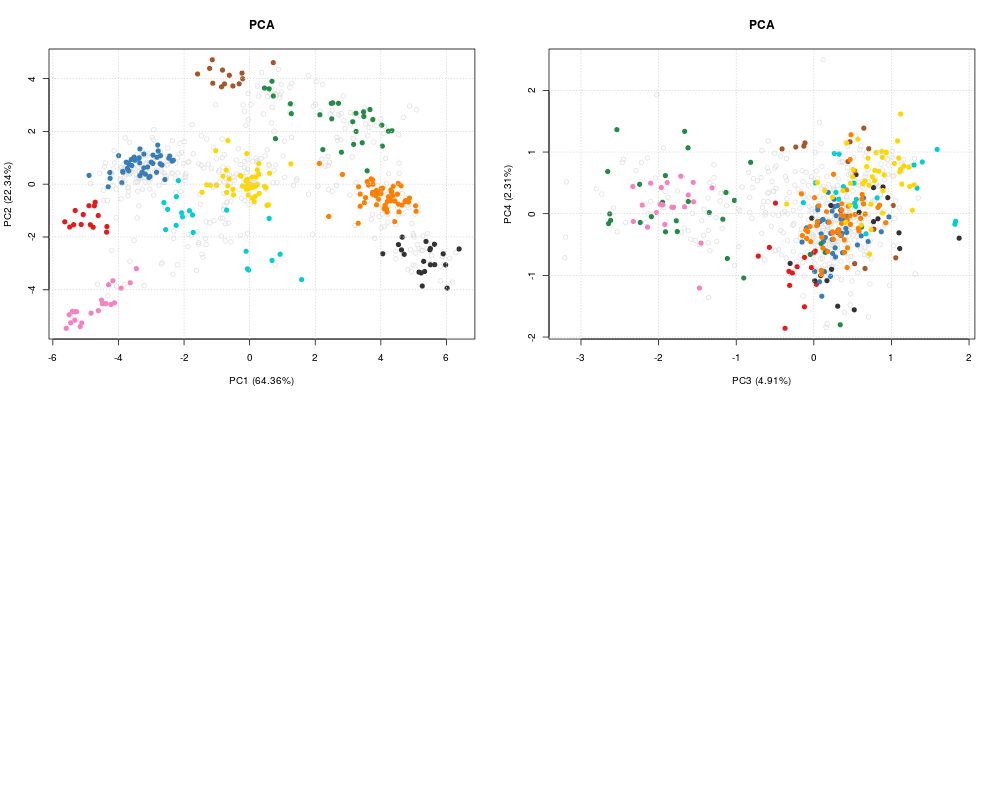
## Multiple PCA plots but different PCs
dims <- list(c(1, 2), c(3, 4))
vis <- SpatProtVis(dunkley2006, methods = c("PCA", "PCA"), dims = dims)
plot(vis)
Results
R version 3.3.1 (2016-06-21) -- "Bug in Your Hair"
Copyright (C) 2016 The R Foundation for Statistical Computing
Platform: x86_64-pc-linux-gnu (64-bit)

R is free software and comes with ABSOLUTELY NO WARRANTY.
You are welcome to redistribute it under certain conditions.
Type 'license()' or 'licence()' for distribution details.

R is a collaborative project with many contributors.
Type 'contributors()' for more information and
'citation()' on how to cite R or R packages in publications.

Type 'demo()' for some demos, 'help()' for on-line help, or
'help.start()' for an HTML browser interface to help.
Type 'q()' to quit R.

> library(pRoloc)
Loading required package: MSnbase
Loading required package: BiocGenerics
Loading required package: parallel

Attaching package: 'BiocGenerics'

The following objects are masked from 'package:parallel':

    clusterApply, clusterApplyLB, clusterCall, clusterEvalQ,
    clusterExport, clusterMap, parApply, parCapply, parLapply,
    parLapplyLB, parRapply, parSapply, parSapplyLB

The following objects are masked from 'package:stats':

    IQR, mad, xtabs

The following objects are masked from 'package:base':

    Filter, Find, Map, Position, Reduce, anyDuplicated, append,
    as.data.frame, cbind, colnames, do.call, duplicated, eval, evalq,
    get, grep, grepl, intersect, is.unsorted, lapply, lengths, mapply,
    match, mget, order, paste, pmax, pmax.int, pmin, pmin.int, rank,
    rbind, rownames, sapply, setdiff, sort, table, tapply, union,
    unique, unsplit

Loading required package: Biobase
Welcome to Bioconductor

    Vignettes contain introductory material; view with
    'browseVignettes()'. To cite Bioconductor, see
    'citation("Biobase")', and for packages 'citation("pkgname")'.

Loading required package: mzR
Loading required package: Rcpp
Loading required package: BiocParallel
Loading required package: ProtGenerics

This is MSnbase version 1.20.7
  Read '?MSnbase' and references therein for information
  about the package and how to get started.


Attaching package: 'MSnbase'

The following object is masked from 'package:stats':

    smooth

The following object is masked from 'package:base':

    trimws

Loading required package: MLInterfaces
Loading required package: annotate
Loading required package: AnnotationDbi
Loading required package: stats4
Loading required package: IRanges
Loading required package: S4Vectors

Attaching package: 'S4Vectors'

The following objects are masked from 'package:base':

    colMeans, colSums, expand.grid, rowMeans, rowSums

Loading required package: XML
Loading required package: cluster

This is pRoloc version 1.12.4
  Read '?pRoloc' and references therein for information
  about the package and how to get started.

> png(filename="/home/ddbj/snapshot/RGM3/R_BC/result/pRoloc/SpatProtVis-class.Rd_%03d_medium.png", width=480, height=480)
> ### Name: SpatProtVis-class
> ### Title: Class 'SpatProtVis'
> ### Aliases: SpatProtVis-class class:SpatProtVis SpatProtVis
> ###   plot,SpatProtVis,missing-method show,SpatProtVis-method
> ### Keywords: classes
>
> ### ** Examples
>
> library("pRolocdata")

This is pRolocdata version 1.10.0.
Use 'pRolocdata()' to list available data sets.
> data(dunkley2006)
> ## Default parameters for a set of methods
> ## (in the interest of time, don't use t-SNE)
> m <- c("PCA", "MDS", "kpca")
> vis <- SpatProtVis(dunkley2006, methods = m)
Producting PCA visualisation...
Producting MDS visualisation...
Producting kpca visualisation...
> vis
Object of class "SpatProtVis"
 Data: dunkley2006
 Visualisation methods: PCA, MDS, kpca
> plot(vis)
Done.
> plot(vis, legend = "topleft")
Done.
>
> ## Setting method arguments
> margs <- c(list(kpar = list(sigma = 0.1)),
+            list(kpar = list(sigma = 1.0)),
+            list(kpar = list(sigma = 10)),
+            list(kpar = list(sigma = 100)))
> vis <- SpatProtVis(dunkley2006,
+                    methods = rep("kpca", 4),
+                    methargs = margs)
Producting kpca visualisation...
Producting kpca visualisation...
Producting kpca visualisation...
Producting kpca visualisation...
> par(mfrow = c(2, 2))
> plot(vis)
Done.
>
> ## Multiple PCA plots but different PCs
> dims <- list(c(1, 2), c(3, 4))
> vis <- SpatProtVis(dunkley2006, methods = c("PCA", "PCA"), dims = dims)
Producting PCA visualisation...
Producting PCA visualisation...
> plot(vis)
Done.
>
>
>
>
>
> dev.off()
null device
          1
>
|