Supported by Dr. Osamu Ogasawara and  . . |
|
Last data update: 2014.03.03 |
Adds markers to the dataDescriptionThe function adds a 'markers' feature variable. These markers are
read from a comma separated values (csv) spreadsheet file. This
markers file is expected to have 2 columns (others are ignored)
where the first is the name of the marker features and the second
the group label. Alternatively, a markers named vector as provided
by the UsageaddMarkers(object, markers, mcol = "markers", fcol, verbose = TRUE) Arguments
DetailsIt is essential to assure that ValueA new instance of class Author(s)Laurent Gatto See AlsoSee Examples
library("pRolocdata")
data(dunkley2006)
atha <- pRolocmarkers("atha")
try(addMarkers(dunkley2006, atha)) ## markers already exists
fData(dunkley2006)$markers.org <- fData(dunkley2006)$markers
fData(dunkley2006)$markers <- NULL
marked <- addMarkers(dunkley2006, atha)
fvarLabels(marked)
## if 'makers' already exists
marked <- addMarkers(marked, atha, mcol = "markers2")
fvarLabels(marked)
stopifnot(all.equal(fData(marked)$markers, fData(marked)$markers2))
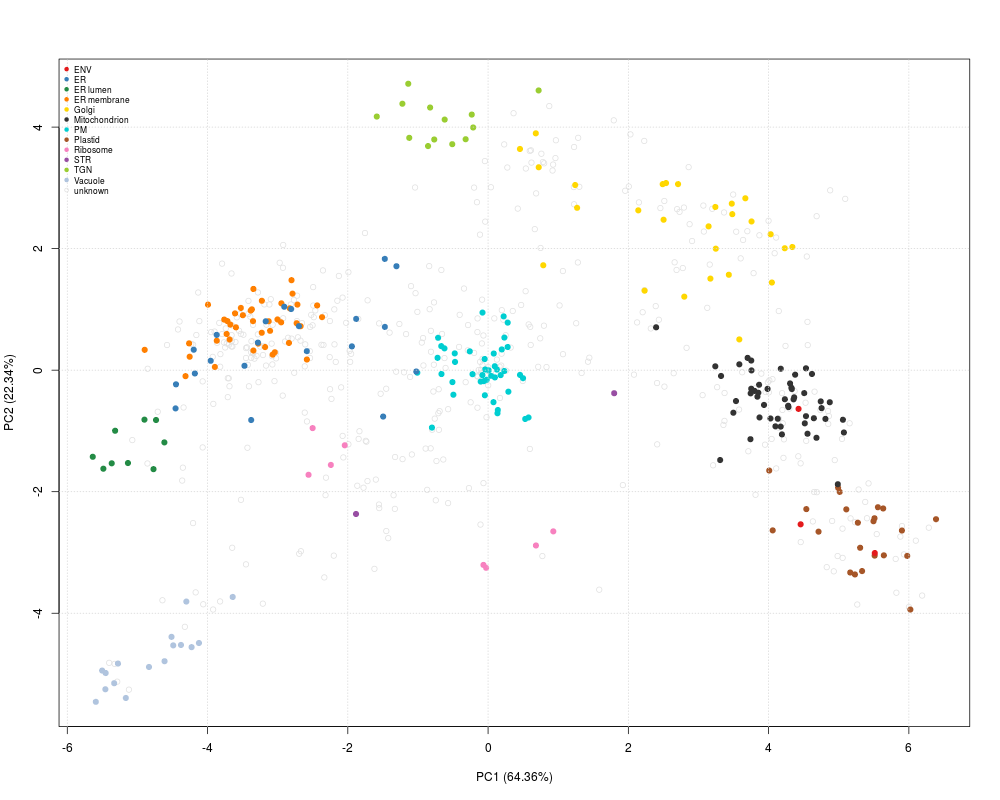
plot2D(marked)
addLegend(marked, where = "topleft", cex = .7)
Results
R version 3.3.1 (2016-06-21) -- "Bug in Your Hair"
Copyright (C) 2016 The R Foundation for Statistical Computing
Platform: x86_64-pc-linux-gnu (64-bit)

R is free software and comes with ABSOLUTELY NO WARRANTY.
You are welcome to redistribute it under certain conditions.
Type 'license()' or 'licence()' for distribution details.

R is a collaborative project with many contributors.
Type 'contributors()' for more information and
'citation()' on how to cite R or R packages in publications.

Type 'demo()' for some demos, 'help()' for on-line help, or
'help.start()' for an HTML browser interface to help.
Type 'q()' to quit R.

> library(pRoloc)
Loading required package: MSnbase
Loading required package: BiocGenerics
Loading required package: parallel

Attaching package: 'BiocGenerics'

The following objects are masked from 'package:parallel':

    clusterApply, clusterApplyLB, clusterCall, clusterEvalQ,
    clusterExport, clusterMap, parApply, parCapply, parLapply,
    parLapplyLB, parRapply, parSapply, parSapplyLB

The following objects are masked from 'package:stats':

    IQR, mad, xtabs

The following objects are masked from 'package:base':

    Filter, Find, Map, Position, Reduce, anyDuplicated, append,
    as.data.frame, cbind, colnames, do.call, duplicated, eval, evalq,
    get, grep, grepl, intersect, is.unsorted, lapply, lengths, mapply,
    match, mget, order, paste, pmax, pmax.int, pmin, pmin.int, rank,
    rbind, rownames, sapply, setdiff, sort, table, tapply, union,
    unique, unsplit

Loading required package: Biobase
Welcome to Bioconductor

    Vignettes contain introductory material; view with
    'browseVignettes()'. To cite Bioconductor, see
    'citation("Biobase")', and for packages 'citation("pkgname")'.

Loading required package: mzR
Loading required package: Rcpp
Loading required package: BiocParallel
Loading required package: ProtGenerics

This is MSnbase version 1.20.7
  Read '?MSnbase' and references therein for information
  about the package and how to get started.


Attaching package: 'MSnbase'

The following object is masked from 'package:stats':

    smooth

The following object is masked from 'package:base':

    trimws

Loading required package: MLInterfaces
Loading required package: annotate
Loading required package: AnnotationDbi
Loading required package: stats4
Loading required package: IRanges
Loading required package: S4Vectors

Attaching package: 'S4Vectors'

The following objects are masked from 'package:base':

    colMeans, colSums, expand.grid, rowMeans, rowSums

Loading required package: XML
Loading required package: cluster

This is pRoloc version 1.12.4
  Read '?pRoloc' and references therein for information
  about the package and how to get started.

> png(filename="/home/ddbj/snapshot/RGM3/R_BC/result/pRoloc/addMarkers.Rd_%03d_medium.png", width=480, height=480)
> ### Name: addMarkers
> ### Title: Adds markers to the data
> ### Aliases: addMarkers
>
> ### ** Examples
>
> library("pRolocdata")

This is pRolocdata version 1.10.0.
Use 'pRolocdata()' to list available data sets.
> data(dunkley2006)
> atha <- pRolocmarkers("atha")
> try(addMarkers(dunkley2006, atha)) ## markers already exists
Error in addMarkers(dunkley2006, atha) :
  Detected an existing 'markers' feature column.
> fData(dunkley2006)$markers.org <- fData(dunkley2006)$markers
> fData(dunkley2006)$markers <- NULL
> marked <- addMarkers(dunkley2006, atha)
Markers in data: 255 out of 689
organelleMarkers
          ENV            ER      ER lumen   ER membrane         Golgi
            3            21             9            42            27
Mitochondrion            PM       Plastid      Ribosome           STR
           50            42            22             8             2
          TGN       Vacuole       unknown
           13            16           434
> fvarLabels(marked)
[1] "assigned"     "evidence"     "method"       "new"          "pd.2013"
[6] "pd.markers"   "markers.orig" "markers.org"  "markers"
> ## if 'makers' already exists
> marked <- addMarkers(marked, atha, mcol = "markers2")
Markers in data: 255 out of 689
organelleMarkers
          ENV            ER      ER lumen   ER membrane         Golgi
            3            21             9            42            27
Mitochondrion            PM       Plastid      Ribosome           STR
           50            42            22             8             2
          TGN       Vacuole       unknown
           13            16           434
> fvarLabels(marked)
 [1] "assigned"     "evidence"     "method"       "new"          "pd.2013"
 [6] "pd.markers"   "markers.orig" "markers.org"  "markers"      "markers2"
> stopifnot(all.equal(fData(marked)$markers, fData(marked)$markers2))
> plot2D(marked)
> addLegend(marked, where = "topleft", cex = .7)
>
>
>
>
>
> dev.off()
null device
          1
>
|