Supported by Dr. Osamu Ogasawara and  . . |
|
Last data update: 2014.03.03 |
Pairwise Distance Computation for Protein Information SetsDescriptionThis function computes the mean (normalised) pairwise distances for pre-defined sets of proteins. UsageclustDist(object, k = 1:5, fcol = "GOAnnotations", n = 5, verbose = TRUE, seed) Arguments
DetailsThe input to the function is a For each protein set, the Note: currently distances are calcualted in Euclidean space, but other distance metrics will be supported in the future). The output is a ValueAn instance of Author(s)Lisa Breckels See AlsoFor class definitions see Examples
library(pRolocdata)
data(dunkley2006)
par <- setAnnotationParams(inputs =
c("Arabidopsis thaliana genes",
"TAIR locus ID"))
## add protein sets/annotation information
xx <- addGoAnnotations(dunkley2006, par)
## filter
xx <- filterMinMarkers(xx, n = 50)
xx <- filterMaxMarkers(xx, p = .25)
## get distances for protein sets
dd <- clustDist(xx)
## plot clusters for first 'ClustDist' object
## in the 'ClustDistList'
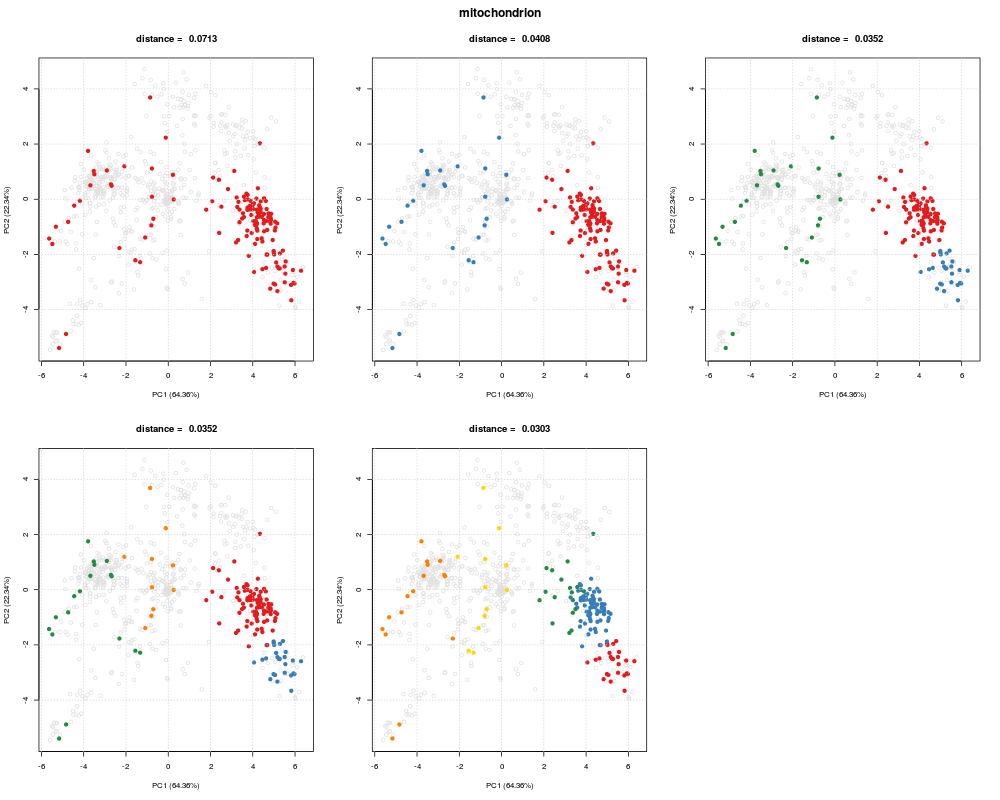
plot(dd[[1]], xx)
## plot distances for all protein sets
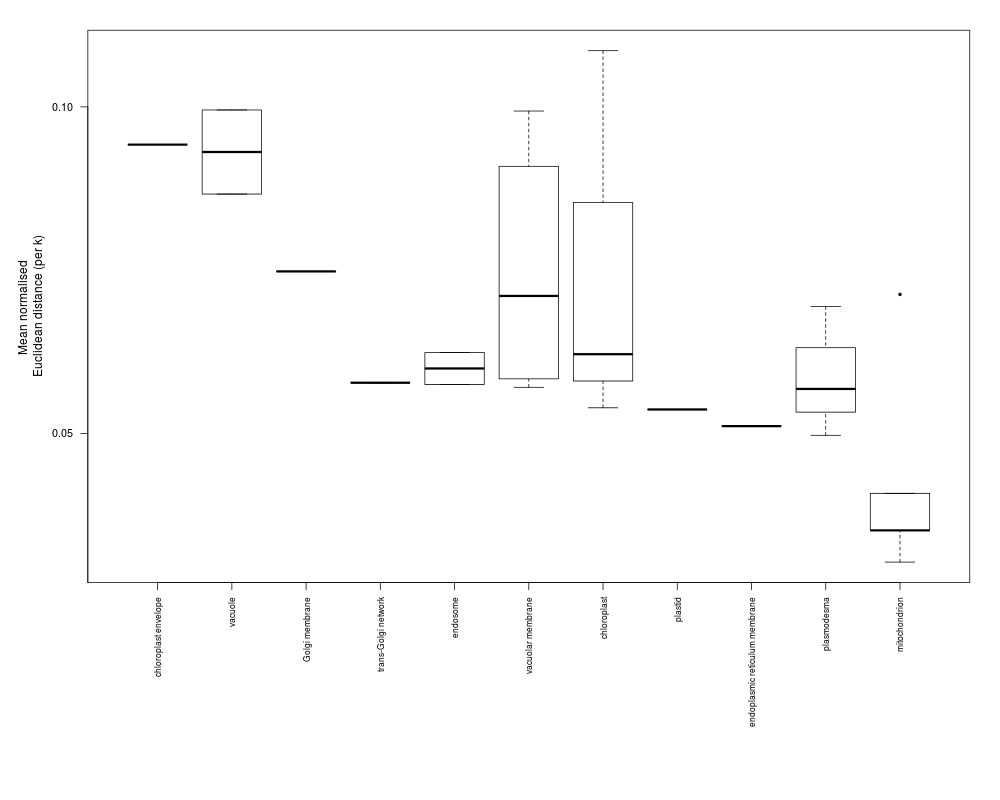
plot(dd)
## Extract normalised distances
## Normalise by n^1/3
minDist <- getNormDist(dd, p = 1/3)
## Get new order according to lowest distance
o <- order(minDist)
## Re-order GOAnnotations
fData(xx)$GOAnnotations <- fData(xx)$GOAnnotations[, o]
if (interactive()) {
pRolocVis(xx, fcol = "GOAnnotations")
}
Results
R version 3.3.1 (2016-06-21) -- "Bug in Your Hair"
Copyright (C) 2016 The R Foundation for Statistical Computing
Platform: x86_64-pc-linux-gnu (64-bit)

R is free software and comes with ABSOLUTELY NO WARRANTY.
You are welcome to redistribute it under certain conditions.
Type 'license()' or 'licence()' for distribution details.

R is a collaborative project with many contributors.
Type 'contributors()' for more information and
'citation()' on how to cite R or R packages in publications.

Type 'demo()' for some demos, 'help()' for on-line help, or
'help.start()' for an HTML browser interface to help.
Type 'q()' to quit R.

> library(pRoloc)
Loading required package: MSnbase
Loading required package: BiocGenerics
Loading required package: parallel

Attaching package: 'BiocGenerics'

The following objects are masked from 'package:parallel':

    clusterApply, clusterApplyLB, clusterCall, clusterEvalQ,
    clusterExport, clusterMap, parApply, parCapply, parLapply,
    parLapplyLB, parRapply, parSapply, parSapplyLB

The following objects are masked from 'package:stats':

    IQR, mad, xtabs

The following objects are masked from 'package:base':

    Filter, Find, Map, Position, Reduce, anyDuplicated, append,
    as.data.frame, cbind, colnames, do.call, duplicated, eval, evalq,
    get, grep, grepl, intersect, is.unsorted, lapply, lengths, mapply,
    match, mget, order, paste, pmax, pmax.int, pmin, pmin.int, rank,
    rbind, rownames, sapply, setdiff, sort, table, tapply, union,
    unique, unsplit

Loading required package: Biobase
Welcome to Bioconductor

    Vignettes contain introductory material; view with
    'browseVignettes()'. To cite Bioconductor, see
    'citation("Biobase")', and for packages 'citation("pkgname")'.

Loading required package: mzR
Loading required package: Rcpp
Loading required package: BiocParallel
Loading required package: ProtGenerics

This is MSnbase version 1.20.7
  Read '?MSnbase' and references therein for information
  about the package and how to get started.


Attaching package: 'MSnbase'

The following object is masked from 'package:stats':

    smooth

The following object is masked from 'package:base':

    trimws

Loading required package: MLInterfaces
Loading required package: annotate
Loading required package: AnnotationDbi
Loading required package: stats4
Loading required package: IRanges
Loading required package: S4Vectors

Attaching package: 'S4Vectors'

The following objects are masked from 'package:base':

    colMeans, colSums, expand.grid, rowMeans, rowSums

Loading required package: XML
Loading required package: cluster

This is pRoloc version 1.12.4
  Read '?pRoloc' and references therein for information
  about the package and how to get started.

> png(filename="/home/ddbj/snapshot/RGM3/R_BC/result/pRoloc/clustDist.Rd_%03d_medium.png", width=480, height=480)
> ### Name: clustDist
> ### Title: Pairwise Distance Computation for Protein Information Sets
> ### Aliases: clustDist
>
> ### ** Examples
>
> library(pRolocdata)

This is pRolocdata version 1.10.0.
Use 'pRolocdata()' to list available data sets.
> data(dunkley2006)
> par <- setAnnotationParams(inputs =
+                    c("Arabidopsis thaliana genes",
+                    "TAIR locus ID"))
Using species Arabidopsis thaliana genes (TAIR10 (2010-09-TAIR10))
Using feature type TAIR locus ID(s)
Connecting to Biomart...
> ## add protein sets/annotation information
> xx <- addGoAnnotations(dunkley2006, par)
Loading required namespace: GO.db

Loading required package: GO.db
> ## filter
> xx <- filterMinMarkers(xx, n = 50)
Retaining 16 out of 153 in GOAnnotations
> xx <- filterMaxMarkers(xx, p = .25)
Retaining 11 out of 16 in GOAnnotations
> ## get distances for protein sets
> dd <- clustDist(xx)
   |                                                                               |                                                                      |   0%   |                                                                               |======                                                                |   9%   |                                                                               |=============                                                         |  18%   |                                                                               |===================                                                   |  27%   |                                                                               |=========================                                             |  36%   |                                                                               |================================                                      |  45%   |                                                                               |======================================                                |  55%   |                                                                               |=============================================                         |  64%   |                                                                               |===================================================                   |  73%   |                                                                               |=========================================================             |  82%   |                                                                               |================================================================      |  91%   |                                                                               |======================================================================| 100%
> ## plot clusters for first 'ClustDist' object
> ## in the 'ClustDistList'
> plot(dd[[1]], xx)
> ## plot distances for all protein sets
> plot(dd)
> ## Extract normalised distances
> ## Normalise by n^1/3
> minDist <- getNormDist(dd, p = 1/3)
> ## Get new order according to lowest distance
> o <- order(minDist)
> ## Re-order GOAnnotations
> fData(xx)$GOAnnotations <- fData(xx)$GOAnnotations[, o]
> #if (interactive()) {
> pRolocVis(xx, fcol = "GOAnnotations")
Error: could not find function "pRolocVis"
Execution halted
|