Supported by Dr. Osamu Ogasawara and  . . |
|
Last data update: 2014.03.03 |
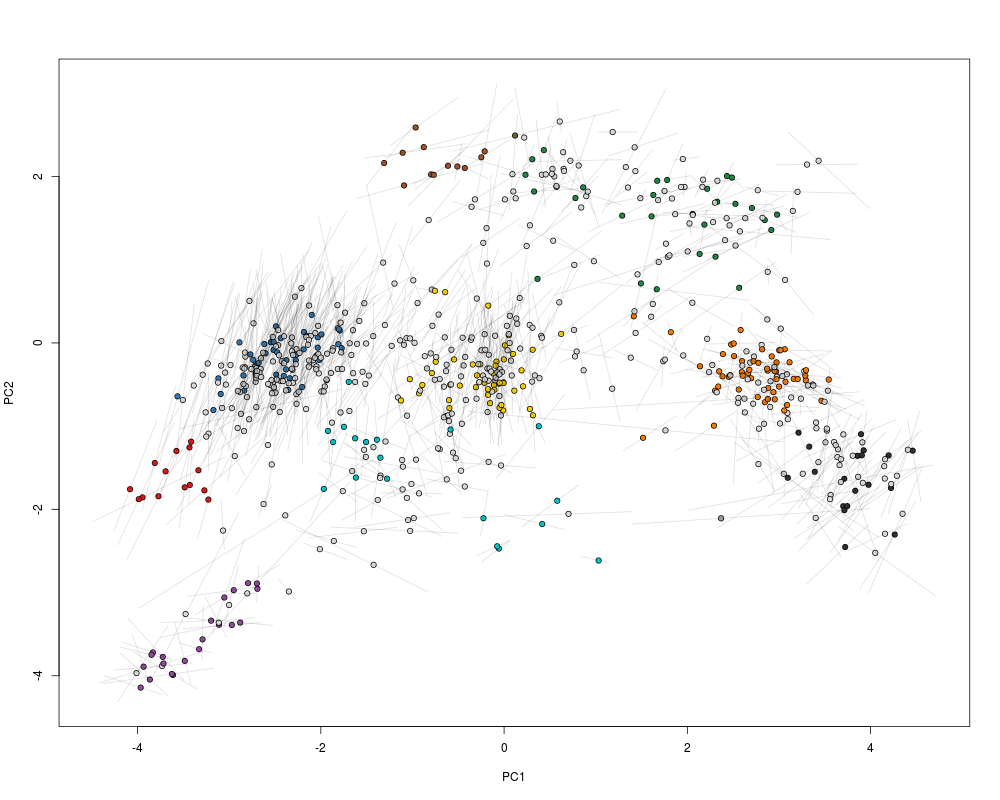
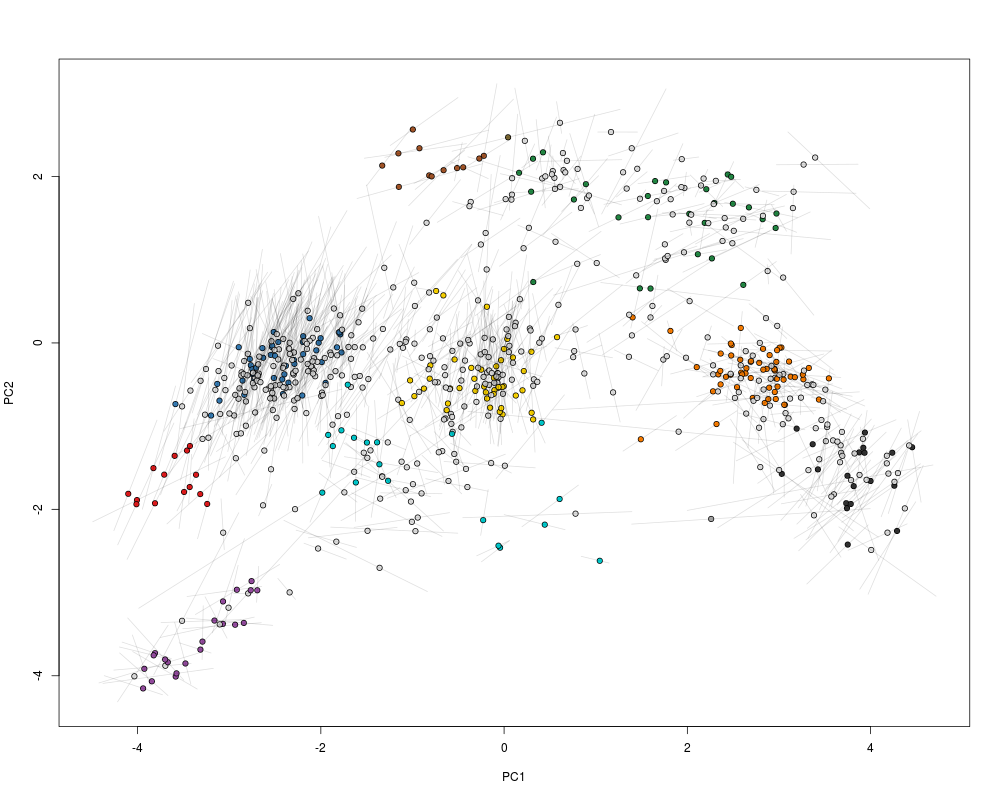
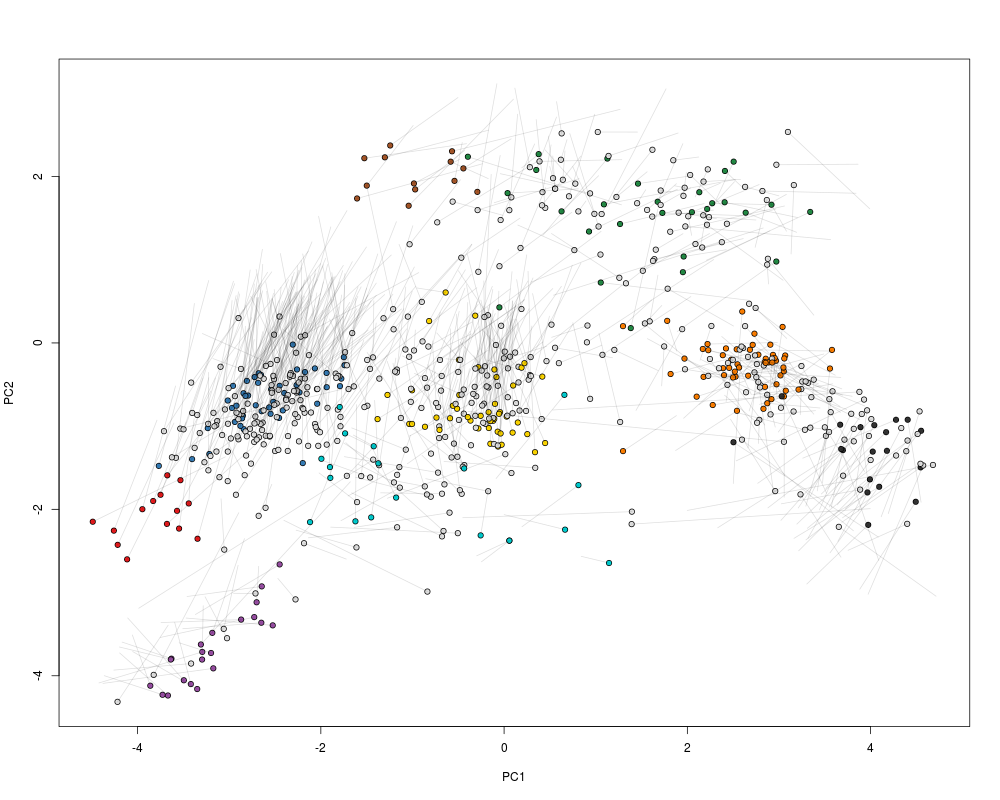
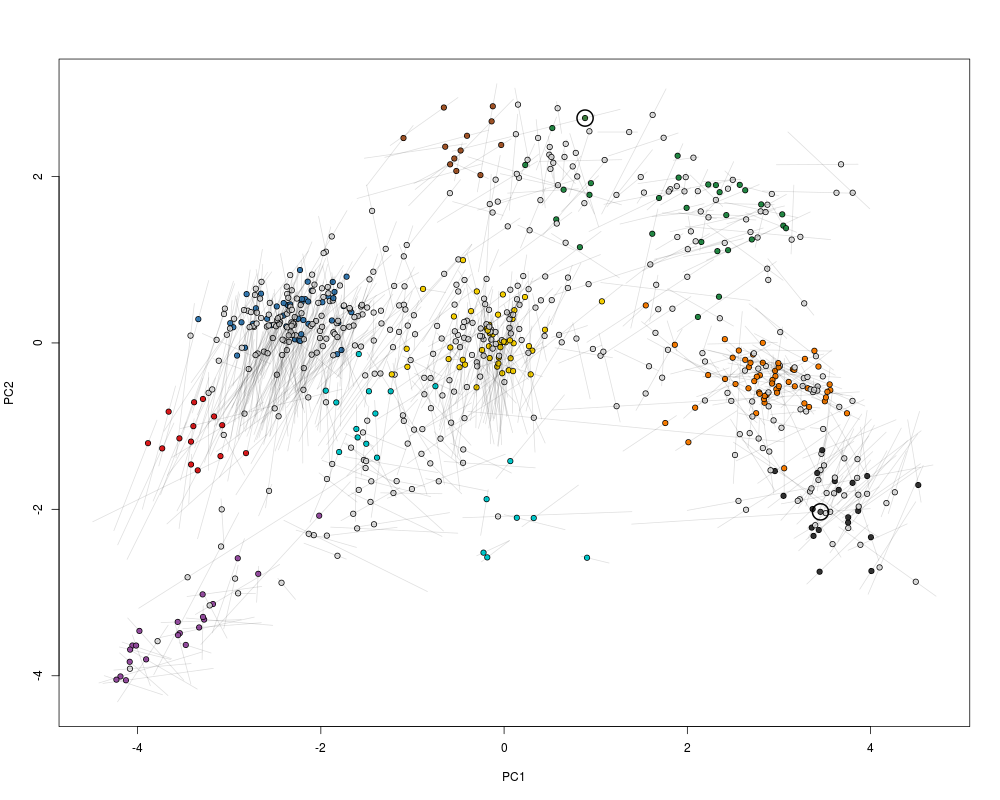
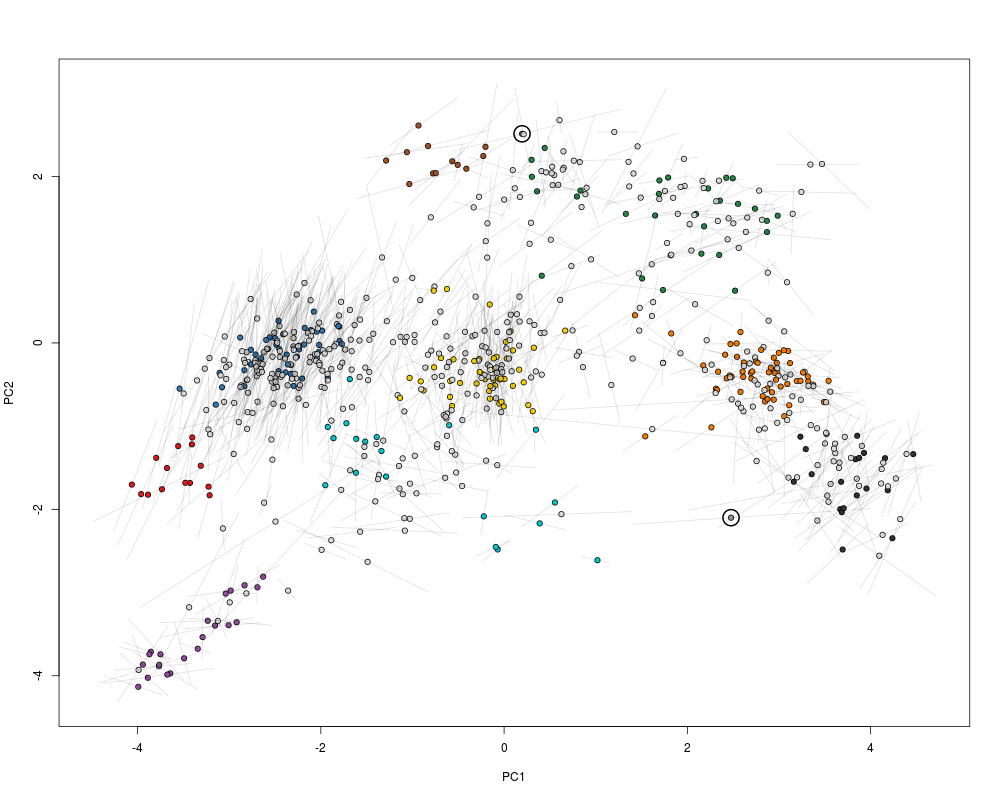
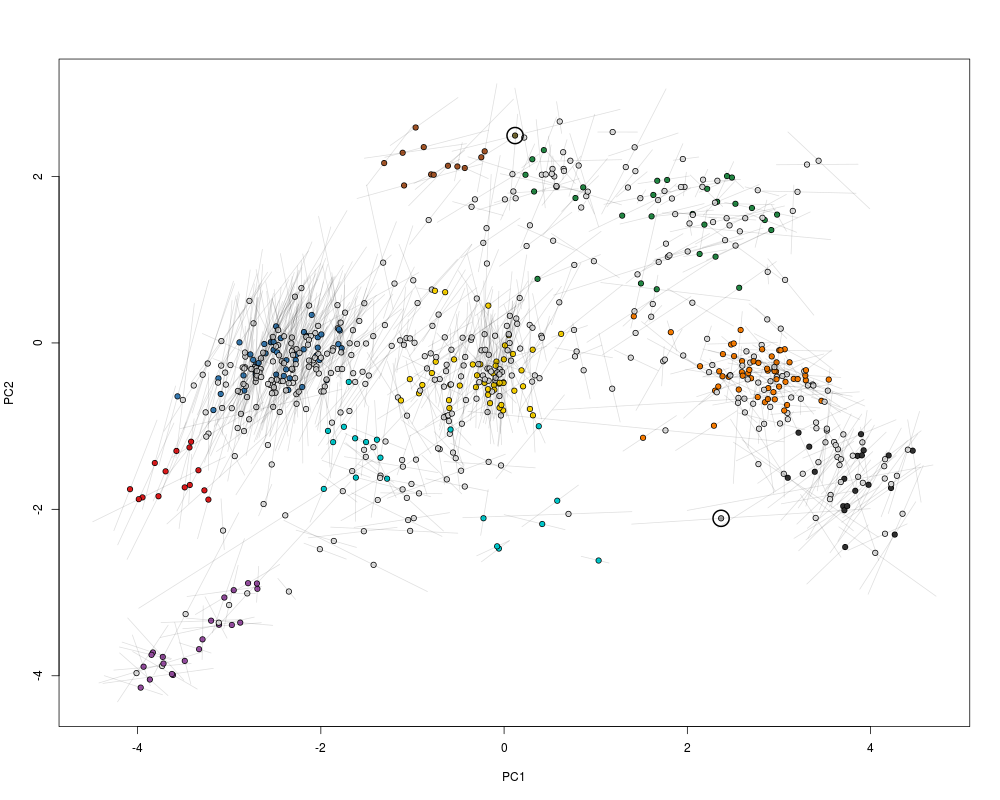
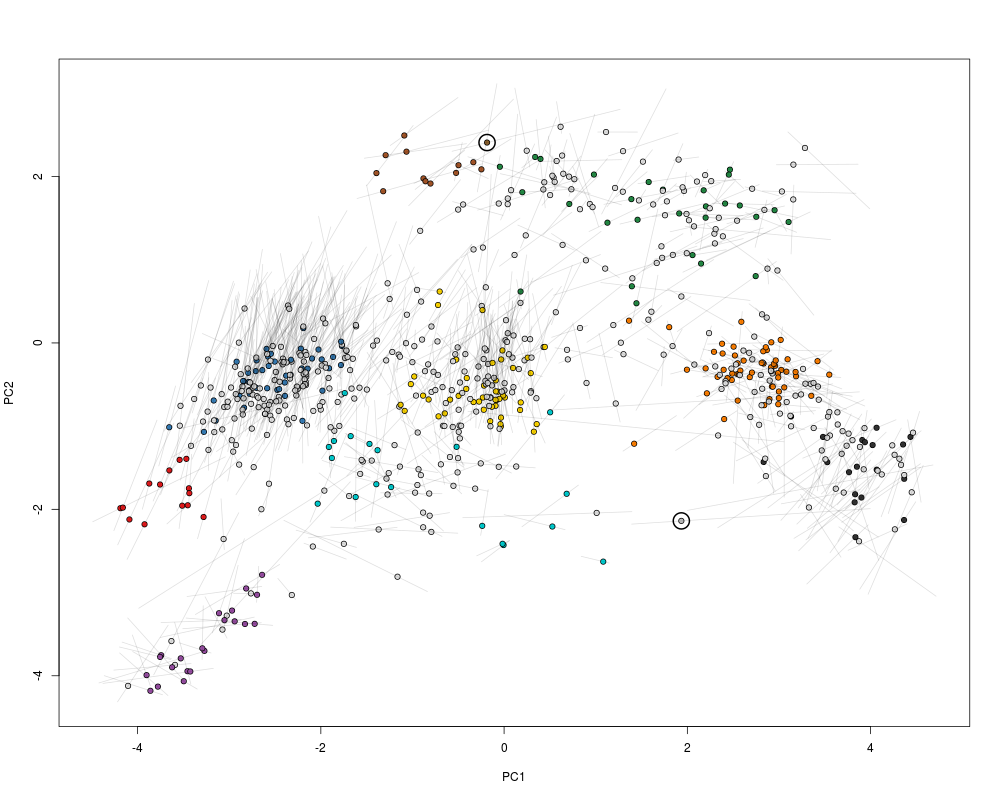
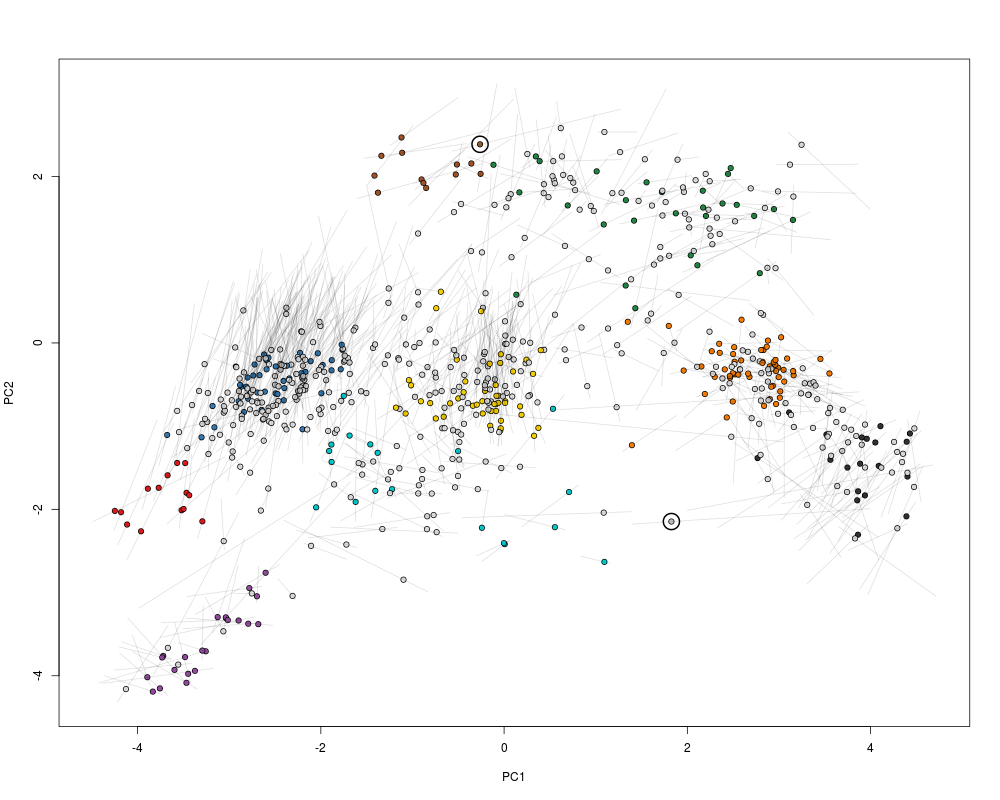
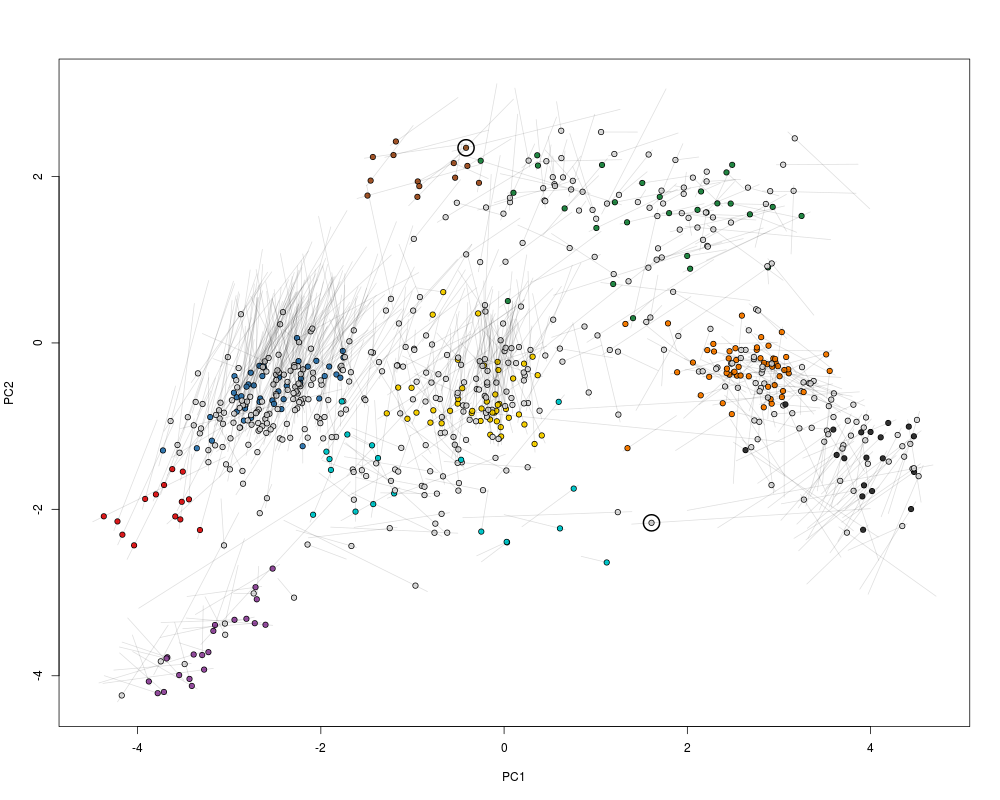
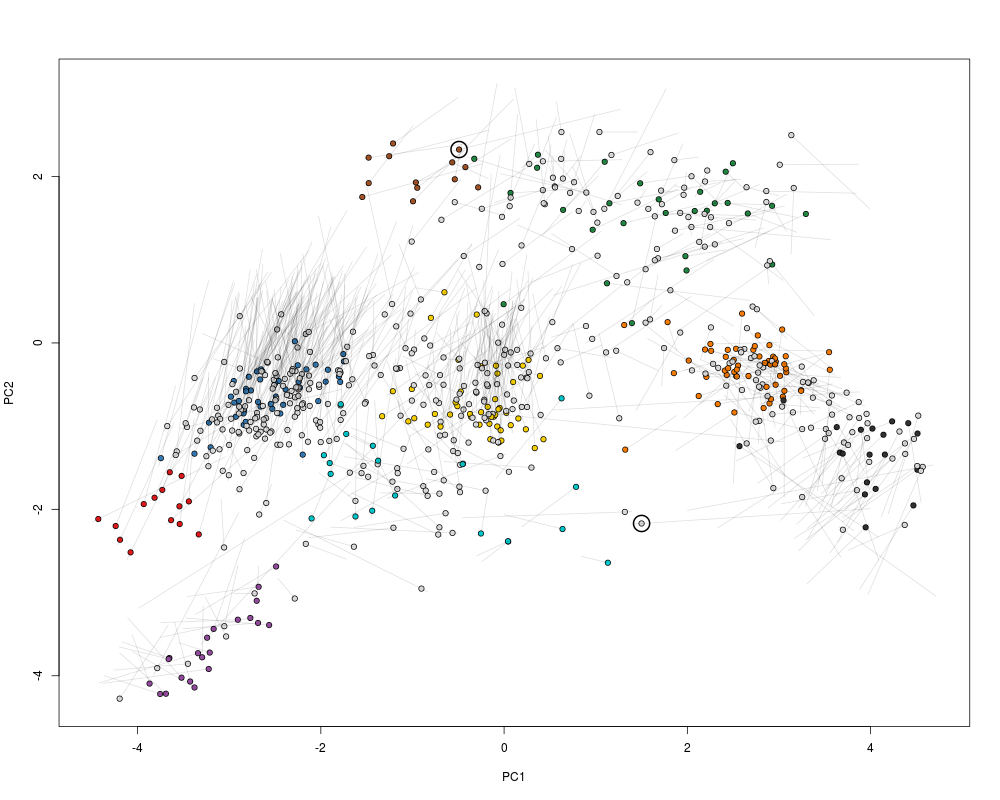
Displays a spatial proteomics animationDescriptionGiven two Usagemove2Ds(object, pcol, fcol = "markers", n = 25, hl) Arguments
ValueUsed for its side effect of producing a short animation. Author(s)Laurent Gatto See Also
Examples
library("pRolocdata")
data(dunkley2006)
## Create a relevant MSnSetList using the dunkley2006 data
xx <- split(dunkley2006, "replicate")
xx1 <- xx[[1]]
xx2 <- xx[[2]]
fData(xx1)$markers[374] <- "Golgi"
fData(xx2)$markers[412] <- "unknown"
xx@x[[1]] <- xx1
xx@x[[2]] <- xx2
## The features we want to track
foi <- FeaturesOfInterest(description = "test",
fnames = featureNames(xx[[1]])[c(374, 412)])
## (1) visualise each experiment separately
par(mfrow = c(2, 1))
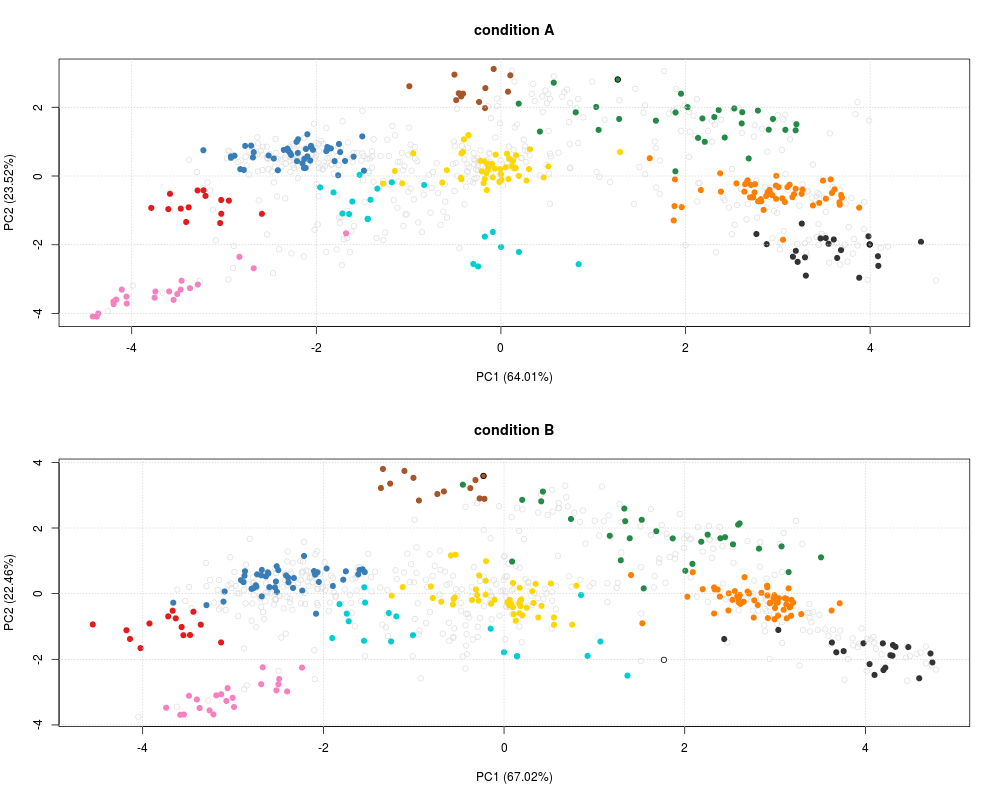
plot2D(xx[[1]], main = "condition A")
highlightOnPlot(xx[[1]], foi)
plot2D(xx[[2]], mirrorY = TRUE, main = "condition B")
highlightOnPlot(xx[[2]], foi, args = list(mirrorY = TRUE))
## (2) plot both data on the same plot
par(mfrow = c(1, 1))
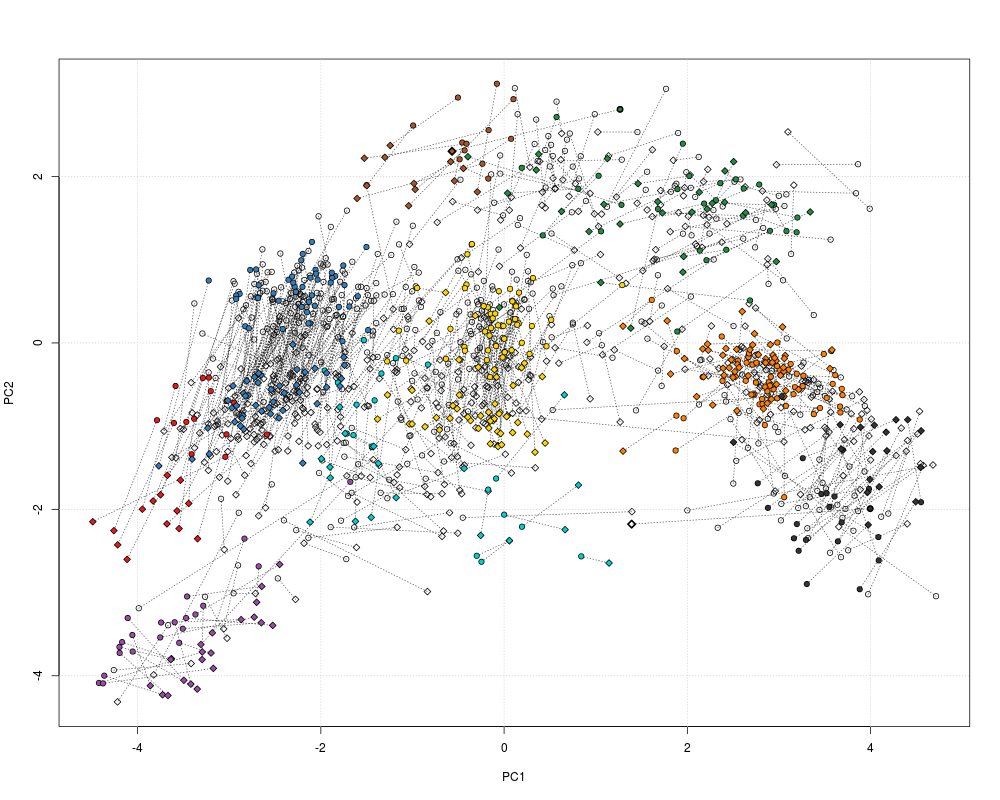
tmp <- plot2Ds(xx)
highlightOnPlot(data1(tmp), foi, lwd = 2)
highlightOnPlot(data2(tmp), foi, pch = 5, lwd = 2)
## (3) create an animation
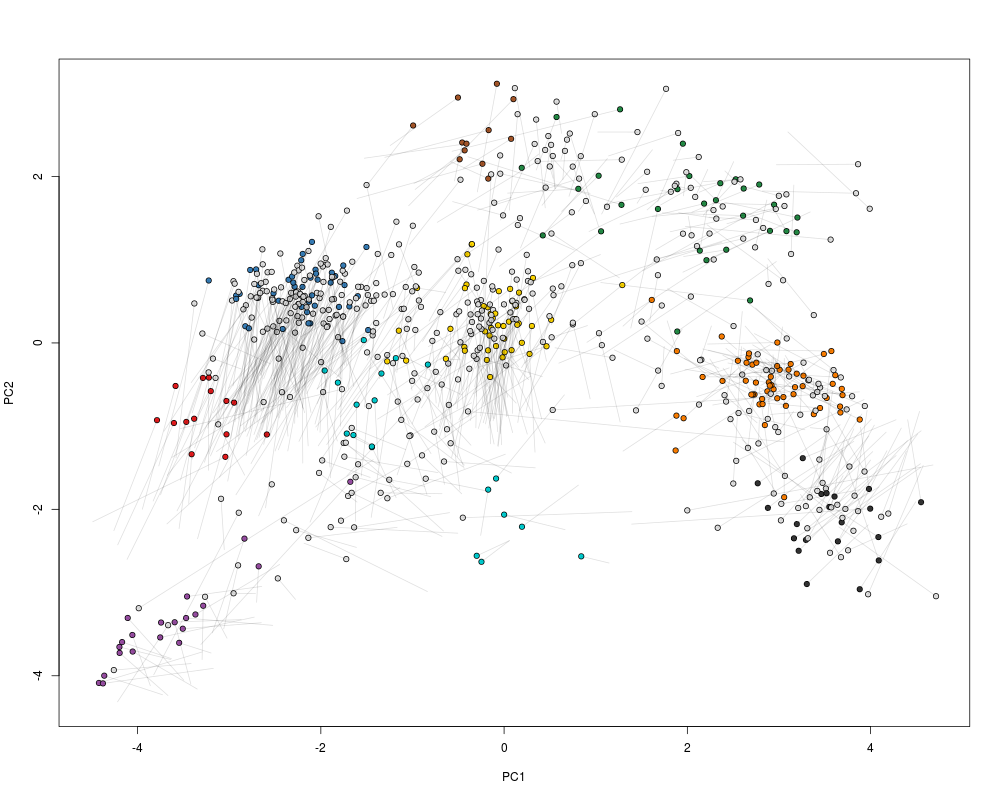
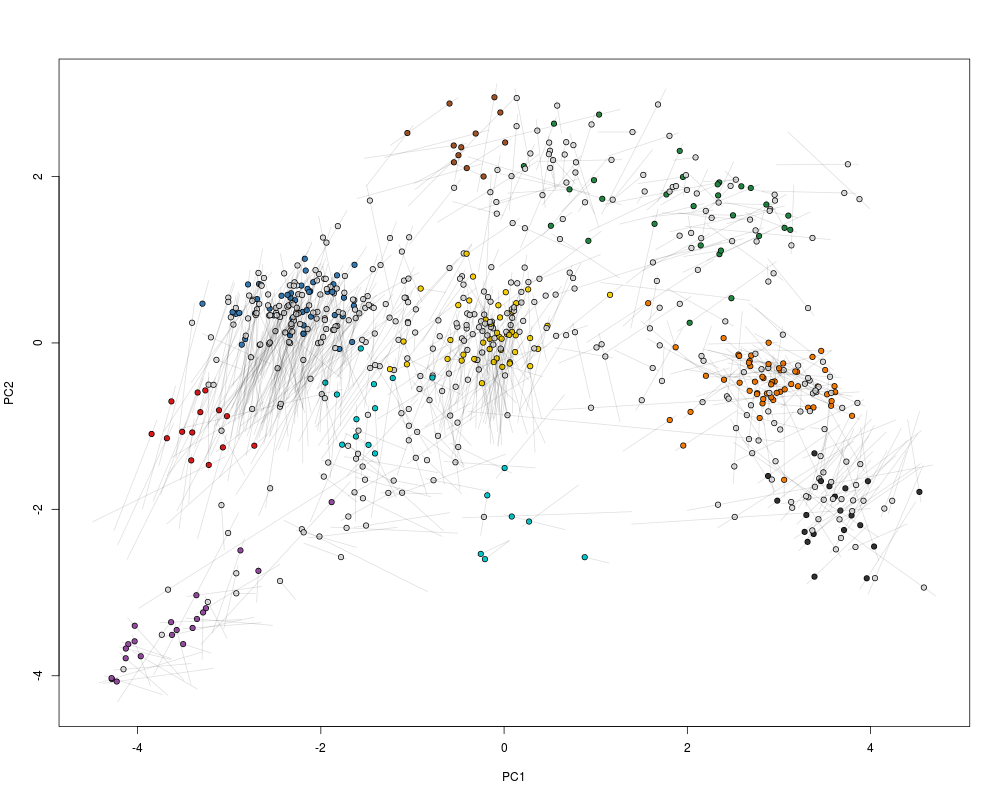
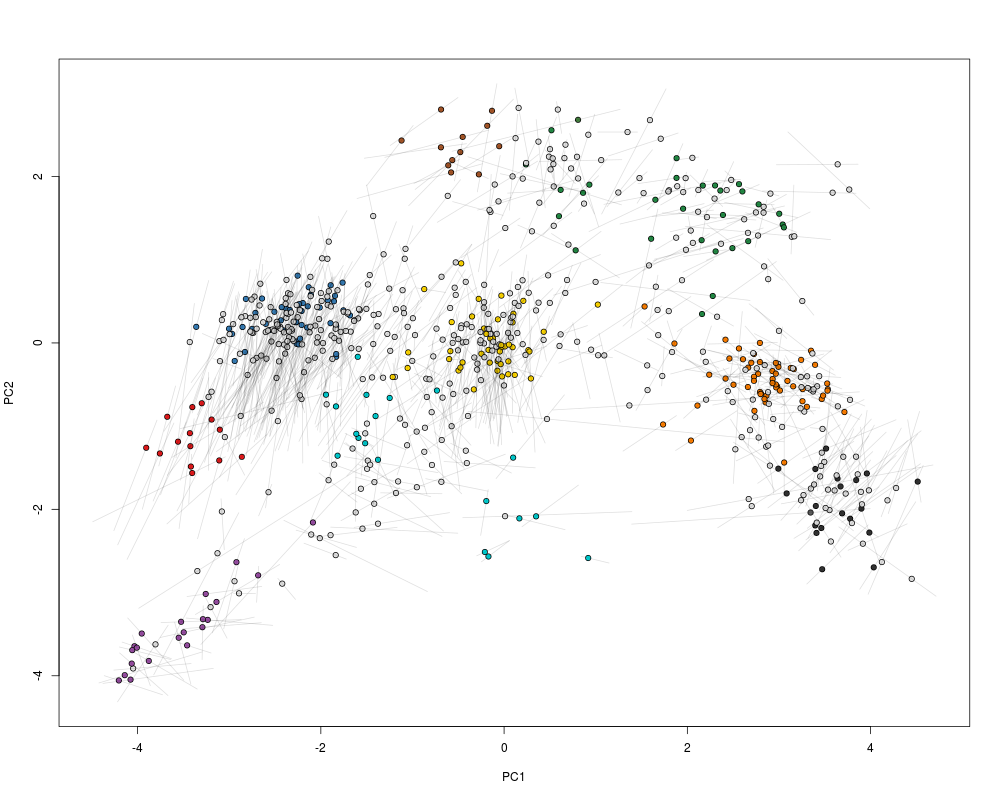
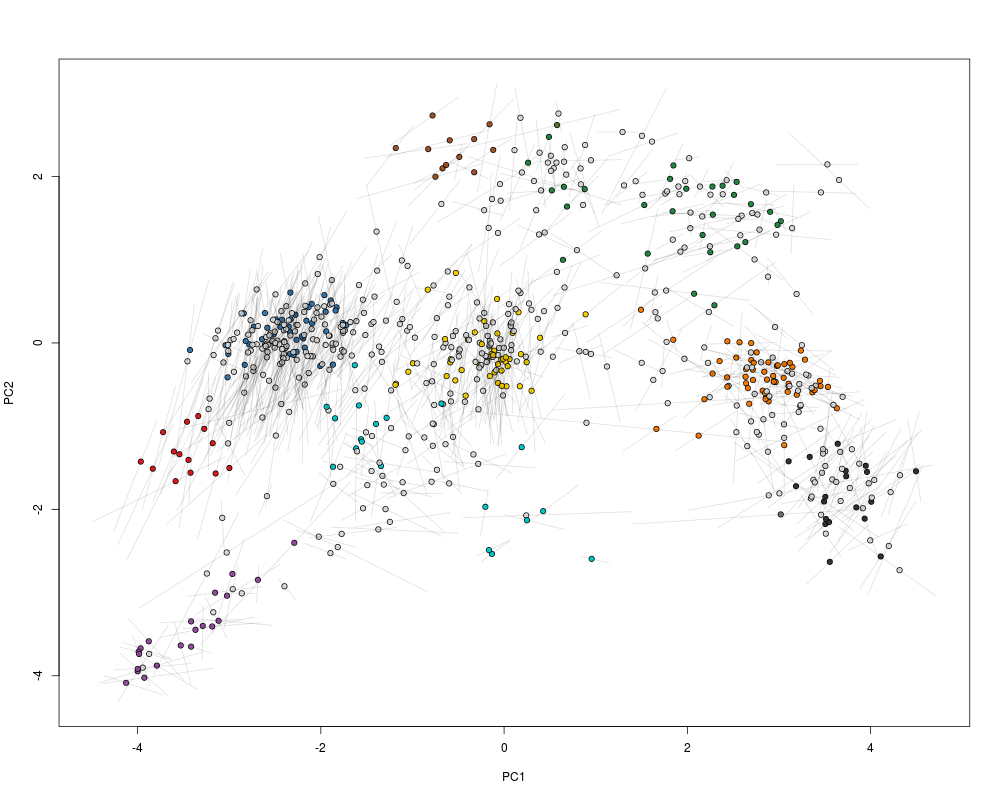
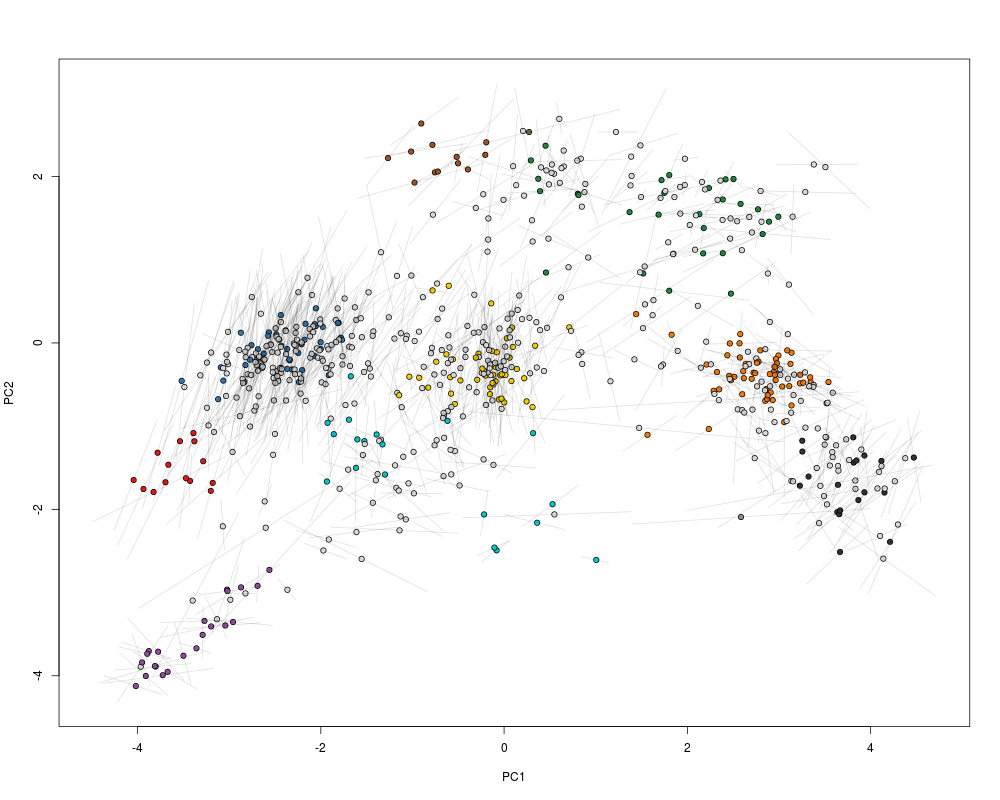
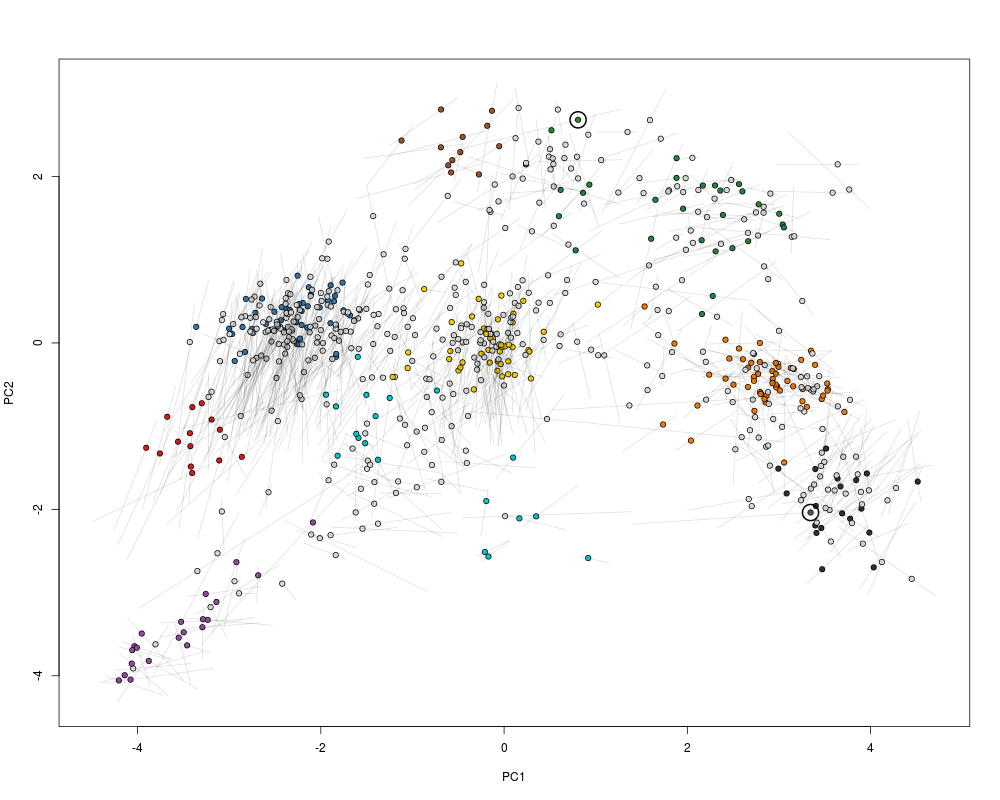
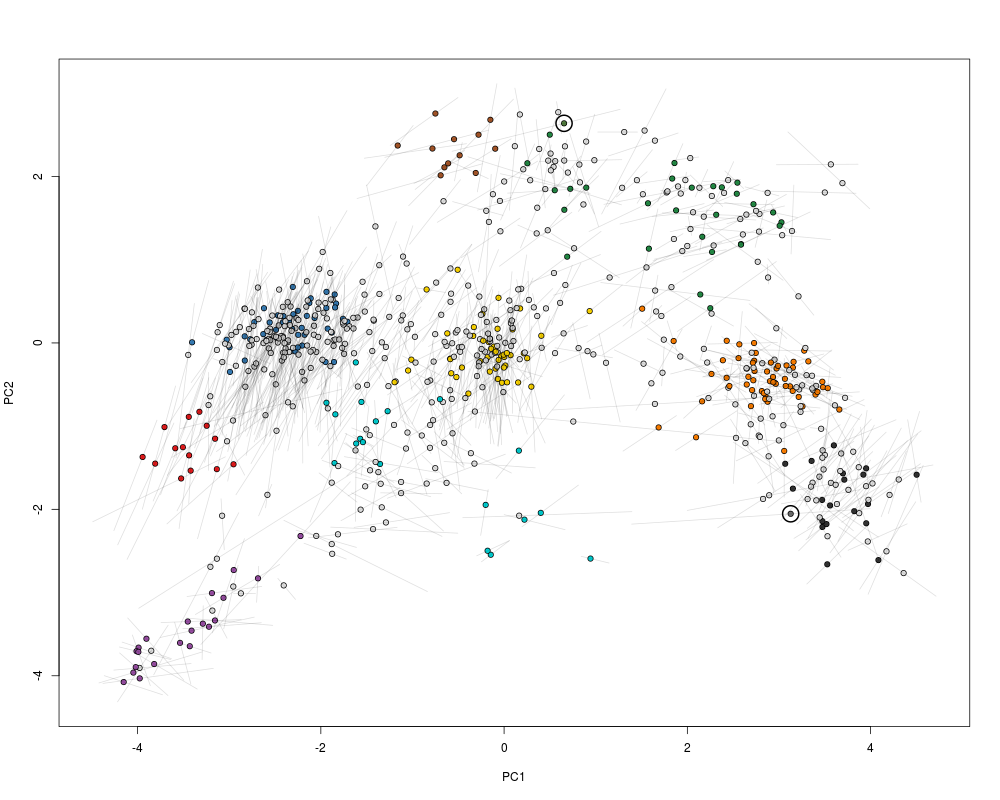
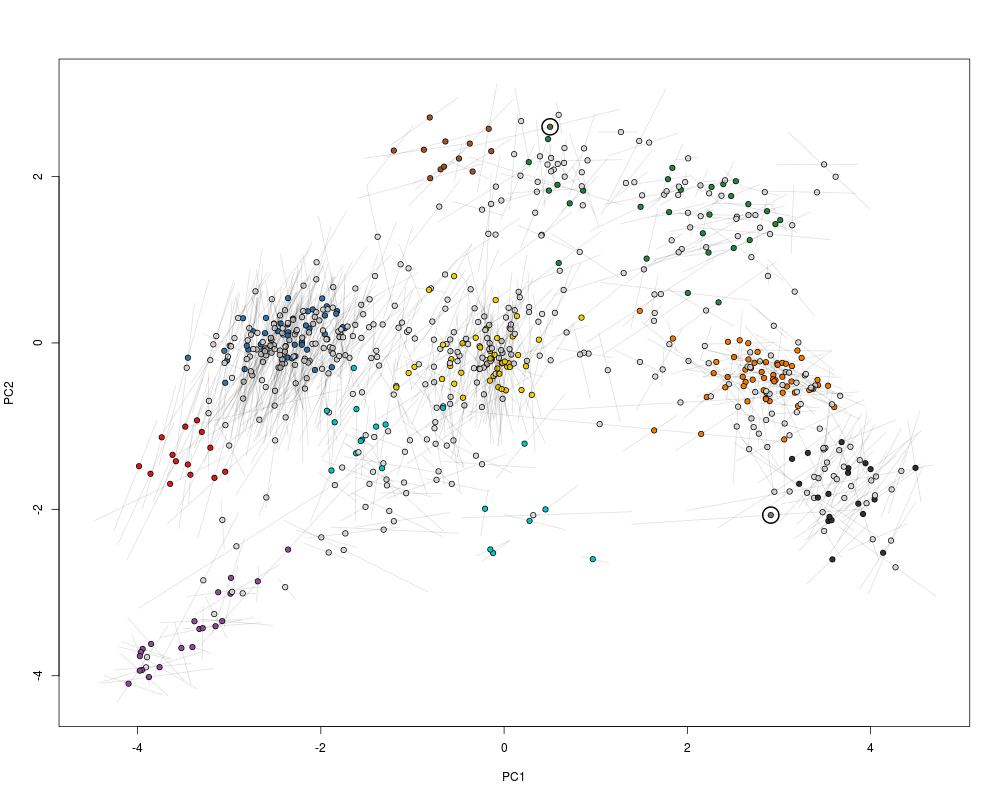
move2Ds(xx, pcol = "replicate")
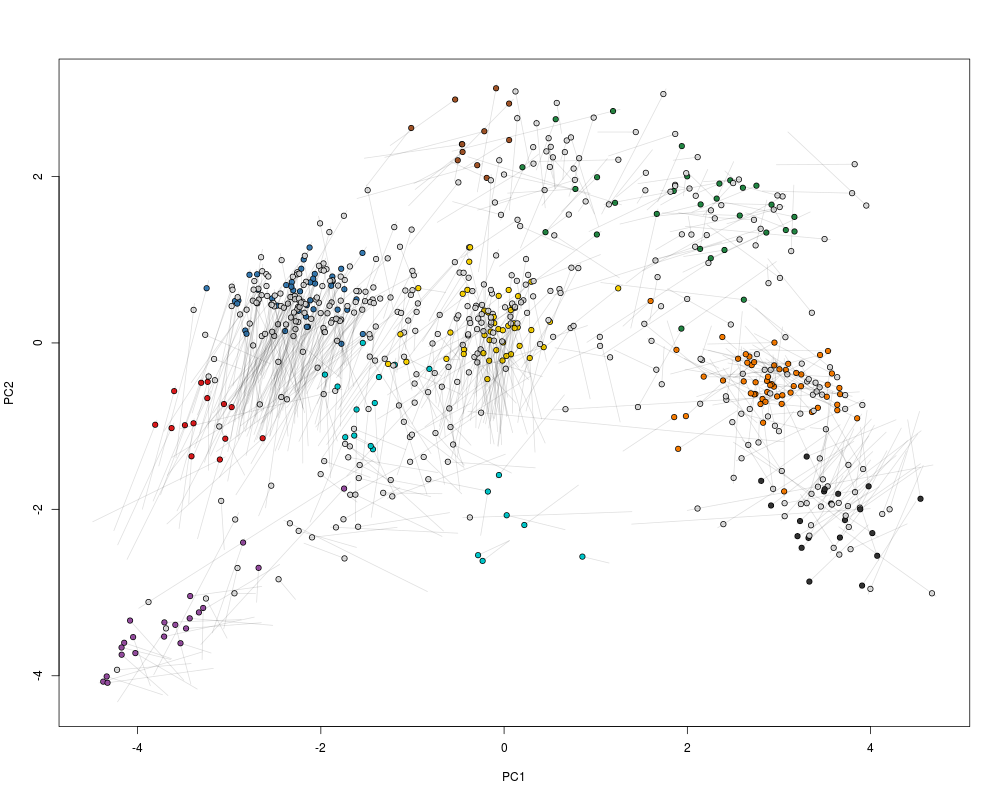
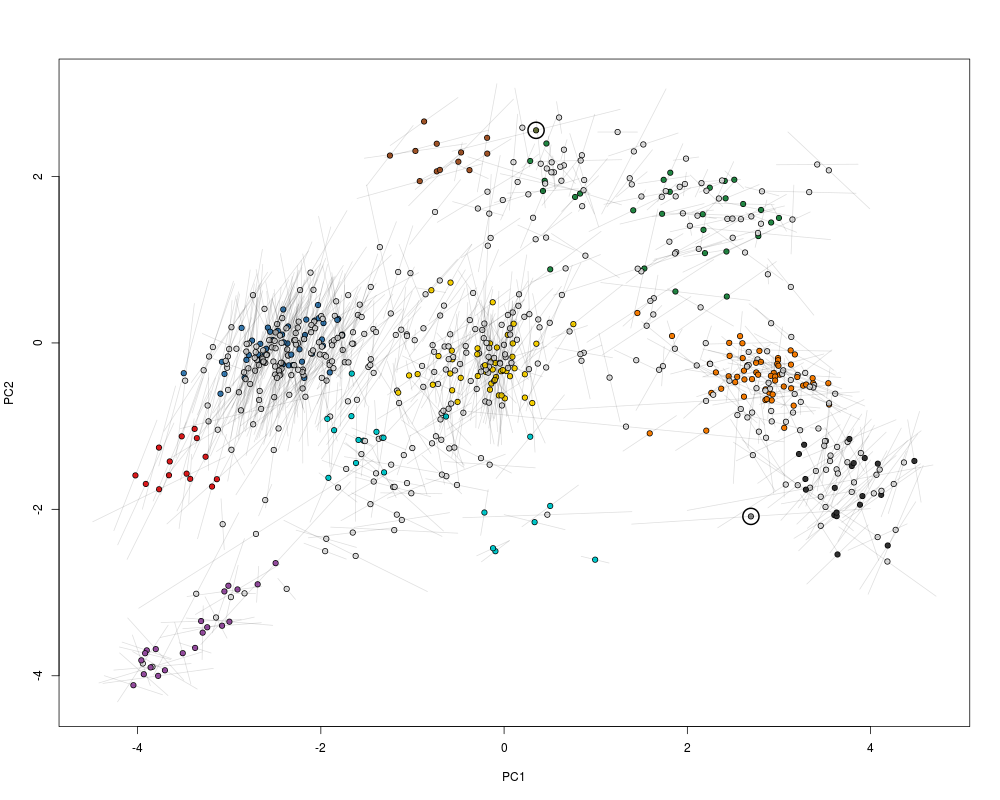
move2Ds(xx, pcol = "replicate", hl = foi)
Results
R version 3.3.1 (2016-06-21) -- "Bug in Your Hair"
Copyright (C) 2016 The R Foundation for Statistical Computing
Platform: x86_64-pc-linux-gnu (64-bit)

R is free software and comes with ABSOLUTELY NO WARRANTY.
You are welcome to redistribute it under certain conditions.
Type 'license()' or 'licence()' for distribution details.

R is a collaborative project with many contributors.
Type 'contributors()' for more information and
'citation()' on how to cite R or R packages in publications.

Type 'demo()' for some demos, 'help()' for on-line help, or
'help.start()' for an HTML browser interface to help.
Type 'q()' to quit R.

> library(pRoloc)
Loading required package: MSnbase
Loading required package: BiocGenerics
Loading required package: parallel

Attaching package: 'BiocGenerics'

The following objects are masked from 'package:parallel':

    clusterApply, clusterApplyLB, clusterCall, clusterEvalQ,
    clusterExport, clusterMap, parApply, parCapply, parLapply,
    parLapplyLB, parRapply, parSapply, parSapplyLB

The following objects are masked from 'package:stats':

    IQR, mad, xtabs

The following objects are masked from 'package:base':

    Filter, Find, Map, Position, Reduce, anyDuplicated, append,
    as.data.frame, cbind, colnames, do.call, duplicated, eval, evalq,
    get, grep, grepl, intersect, is.unsorted, lapply, lengths, mapply,
    match, mget, order, paste, pmax, pmax.int, pmin, pmin.int, rank,
    rbind, rownames, sapply, setdiff, sort, table, tapply, union,
    unique, unsplit

Loading required package: Biobase
Welcome to Bioconductor

    Vignettes contain introductory material; view with
    'browseVignettes()'. To cite Bioconductor, see
    'citation("Biobase")', and for packages 'citation("pkgname")'.

Loading required package: mzR
Loading required package: Rcpp
Loading required package: BiocParallel
Loading required package: ProtGenerics

This is MSnbase version 1.20.7
  Read '?MSnbase' and references therein for information
  about the package and how to get started.


Attaching package: 'MSnbase'

The following object is masked from 'package:stats':

    smooth

The following object is masked from 'package:base':

    trimws

Loading required package: MLInterfaces
Loading required package: annotate
Loading required package: AnnotationDbi
Loading required package: stats4
Loading required package: IRanges
Loading required package: S4Vectors

Attaching package: 'S4Vectors'

The following objects are masked from 'package:base':

    colMeans, colSums, expand.grid, rowMeans, rowSums

Loading required package: XML
Loading required package: cluster

This is pRoloc version 1.12.4
  Read '?pRoloc' and references therein for information
  about the package and how to get started.

> png(filename="/home/ddbj/snapshot/RGM3/R_BC/result/pRoloc/move2Ds.Rd_%03d_medium.png", width=480, height=480)
> ### Name: move2Ds
> ### Title: Displays a spatial proteomics animation
> ### Aliases: move2Ds
>
> ### ** Examples
>
> library("pRolocdata")

This is pRolocdata version 1.10.0.
Use 'pRolocdata()' to list available data sets.
> data(dunkley2006)
>
> ## Create a relevant MSnSetList using the dunkley2006 data
> xx <- split(dunkley2006, "replicate")
> xx1 <- xx[[1]]
> xx2 <- xx[[2]]
> fData(xx1)$markers[374] <- "Golgi"
> fData(xx2)$markers[412] <- "unknown"
> xx@x[[1]] <- xx1
> xx@x[[2]] <- xx2
>
> ## The features we want to track
> foi <- FeaturesOfInterest(description = "test",
+                           fnames = featureNames(xx[[1]])[c(374, 412)])
>
> ## (1) visualise each experiment separately
> par(mfrow = c(2, 1))
> plot2D(xx[[1]], main = "condition A")
> highlightOnPlot(xx[[1]], foi)
> plot2D(xx[[2]], mirrorY = TRUE, main = "condition B")
> highlightOnPlot(xx[[2]], foi, args = list(mirrorY = TRUE))
>
> ## (2) plot both data on the same plot
> par(mfrow = c(1, 1))
> tmp <- plot2Ds(xx)
> highlightOnPlot(data1(tmp), foi, lwd = 2)
> highlightOnPlot(data2(tmp), foi, pch = 5, lwd = 2)
>
> ## (3) create an animation
> move2Ds(xx, pcol = "replicate")
> move2Ds(xx, pcol = "replicate", hl = foi)
>
>
>
>
>
> dev.off()
null device
          1
>
|