Supported by Dr. Osamu Ogasawara and  . . |
|
Last data update: 2014.03.03 |
nnet classificationDescriptionClassification using the artificial neural network algorithm. Usage
nnetClassification(object, assessRes, scores = c("prediction", "all", "none"),
  decay, size, fcol = "markers", ...)
Arguments
ValueAn instance of class Author(s)Laurent Gatto Exampleslibrary(pRolocdata) data(dunkley2006) ## reducing parameter search space and iterations params <- nnetOptimisation(dunkley2006, decay = 10^(c(-1, -5)), size = c(5, 10), times = 3) params plot(params) f1Count(params) levelPlot(params) getParams(params) res <- nnetClassification(dunkley2006, params) getPredictions(res, fcol = "nnet") getPredictions(res, fcol = "nnet", t = 0.75) plot2D(res, fcol = "nnet") Results
R version 3.3.1 (2016-06-21) -- "Bug in Your Hair"
Copyright (C) 2016 The R Foundation for Statistical Computing
Platform: x86_64-pc-linux-gnu (64-bit)
R is free software and comes with ABSOLUTELY NO WARRANTY.
You are welcome to redistribute it under certain conditions.
Type 'license()' or 'licence()' for distribution details.
R is a collaborative project with many contributors.
Type 'contributors()' for more information and
'citation()' on how to cite R or R packages in publications.
Type 'demo()' for some demos, 'help()' for on-line help, or
'help.start()' for an HTML browser interface to help.
Type 'q()' to quit R.
> library(pRoloc)
Loading required package: MSnbase
Loading required package: BiocGenerics
Loading required package: parallel
Attaching package: 'BiocGenerics'
The following objects are masked from 'package:parallel':
clusterApply, clusterApplyLB, clusterCall, clusterEvalQ,
clusterExport, clusterMap, parApply, parCapply, parLapply,
parLapplyLB, parRapply, parSapply, parSapplyLB
The following objects are masked from 'package:stats':
IQR, mad, xtabs
The following objects are masked from 'package:base':
Filter, Find, Map, Position, Reduce, anyDuplicated, append,
as.data.frame, cbind, colnames, do.call, duplicated, eval, evalq,
get, grep, grepl, intersect, is.unsorted, lapply, lengths, mapply,
match, mget, order, paste, pmax, pmax.int, pmin, pmin.int, rank,
rbind, rownames, sapply, setdiff, sort, table, tapply, union,
unique, unsplit
Loading required package: Biobase
Welcome to Bioconductor
Vignettes contain introductory material; view with
'browseVignettes()'. To cite Bioconductor, see
'citation("Biobase")', and for packages 'citation("pkgname")'.
Loading required package: mzR
Loading required package: Rcpp
Loading required package: BiocParallel
Loading required package: ProtGenerics
This is MSnbase version 1.20.7
Read '?MSnbase' and references therein for information
about the package and how to get started.
Attaching package: 'MSnbase'
The following object is masked from 'package:stats':
smooth
The following object is masked from 'package:base':
trimws
Loading required package: MLInterfaces
Loading required package: annotate
Loading required package: AnnotationDbi
Loading required package: stats4
Loading required package: IRanges
Loading required package: S4Vectors
Attaching package: 'S4Vectors'
The following objects are masked from 'package:base':
colMeans, colSums, expand.grid, rowMeans, rowSums
Loading required package: XML
Loading required package: cluster
This is pRoloc version 1.12.4
Read '?pRoloc' and references therein for information
about the package and how to get started.
> png(filename="/home/ddbj/snapshot/RGM3/R_BC/result/pRoloc/nnetClassification.Rd_%03d_medium.png", width=480, height=480)
> ### Name: nnetClassification
> ### Title: nnet classification
> ### Aliases: nnetClassification nnetPrediction
>
> ### ** Examples
>
> library(pRolocdata)
This is pRolocdata version 1.10.0.
Use 'pRolocdata()' to list available data sets.
> data(dunkley2006)
> ## reducing parameter search space and iterations
> params <- nnetOptimisation(dunkley2006, decay = 10^(c(-1, -5)), size = c(5, 10), times = 3)
| | | 0% | |===== | 7% | |========= | 13% | |============== | 20% | |=================== | 27% | |======================= | 33% | |============================ | 40% | |================================= | 47% | |===================================== | 53% | |========================================== | 60% | |=============================================== | 67% | |=================================================== | 73% | |======================================================== | 80% | |============================================================= | 87% | |================================================================= | 93% | |======================================================================| 100%
> params
Object of class "GenRegRes"
Algorithm: nnet
Hyper-parameters:
decay: 0.1 1e-05
size: 5 10
Design:
Replication: 3 x 5-fold X-validation
Partitioning: 0.2/0.8 (test/train)
Results
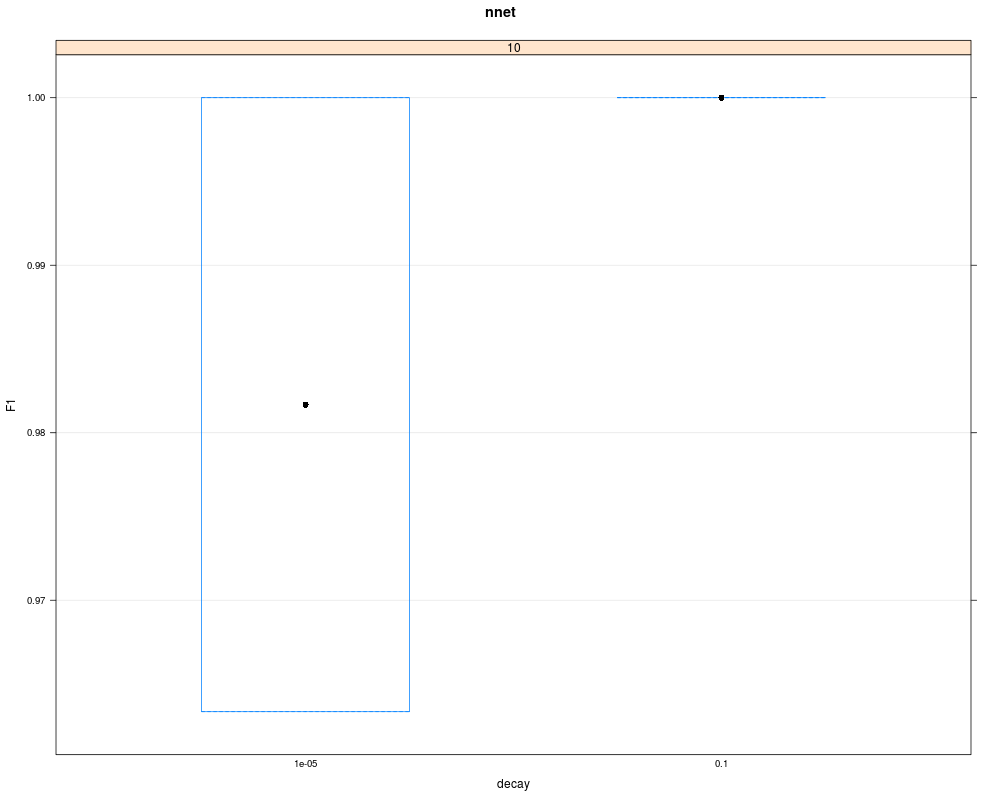
macro F1:
Min. 1st Qu. Median Mean 3rd Qu. Max.
0.9497 0.9645 0.9793 0.9712 0.9820 0.9846
best decay: 1e-05 0.1
best size: 10 5
> plot(params)
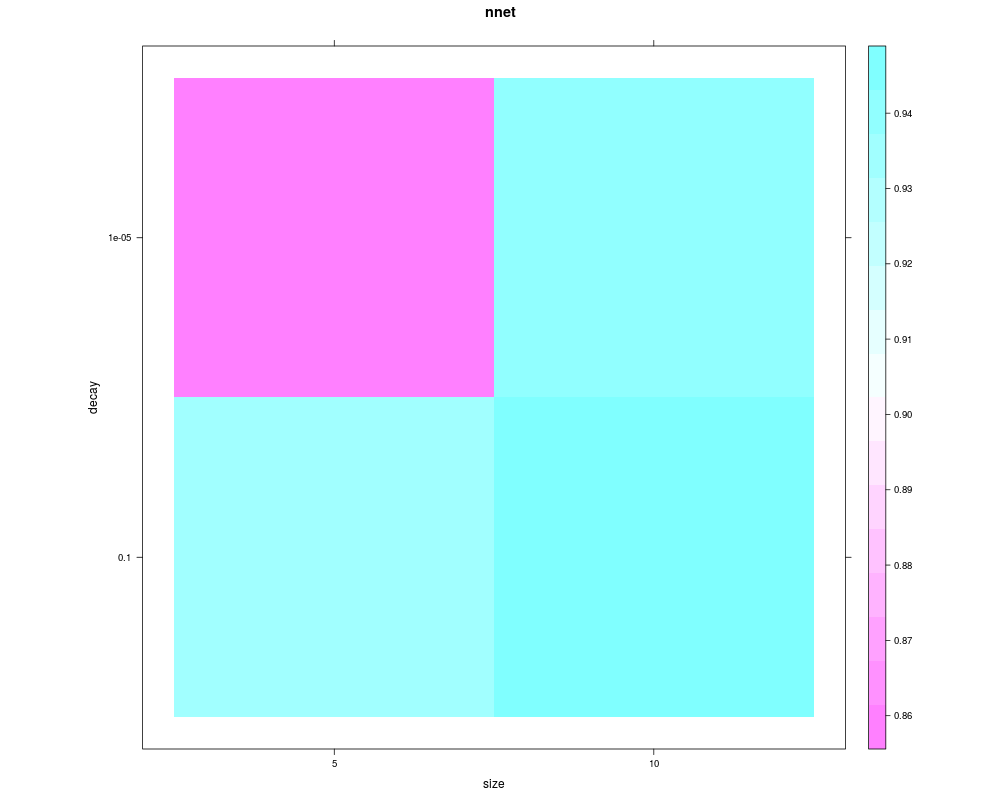
> f1Count(params)
5 10
1e-05 NA 0
0.1 1 NA
> levelPlot(params)
> getParams(params)
decay size
0.1 5.0
> res <- nnetClassification(dunkley2006, params)
# weights: 139
initial value 604.127477
iter 10 value 435.911453
iter 20 value 252.788183
iter 30 value 192.384300
iter 40 value 171.470390
iter 50 value 167.444894
iter 60 value 166.266704
iter 70 value 165.833279
iter 80 value 165.705736
iter 90 value 165.676107
iter 100 value 165.668645
final value 165.668645
stopped after 100 iterations
> getPredictions(res, fcol = "nnet")
ans
ER lumen ER membrane Golgi Mitochondrion PM
19 185 95 106 131
Plastid Ribosome TGN vacuole
49 51 19 34
MSnSet (storageMode: lockedEnvironment)
assayData: 689 features, 16 samples
element names: exprs
protocolData: none
phenoData
sampleNames: M1F1A M1F4A ... M2F11B (16 total)
varLabels: membrane.prep fraction replicate
varMetadata: labelDescription
featureData
featureNames: AT1G09210 AT1G21750 ... AT4G39080 (689 total)
fvarLabels: assigned evidence ... nnet.pred (11 total)
fvarMetadata: labelDescription
experimentData: use 'experimentData(object)'
pubMedIds: 16618929
Annotation:
- - - Processing information - - -
Loaded on Thu Jul 16 22:53:08 2015.
Normalised to sum of intensities.
Added markers from 'mrk' marker vector. Thu Jul 16 22:53:08 2015
Performed nnet prediction (decay=0.1 size=5) Thu Jul 7 01:45:04 2016
Added nnet predictions according to global threshold = 0 Thu Jul 7 01:45:04 2016
MSnbase version: 1.17.12
> getPredictions(res, fcol = "nnet", t = 0.75)
ans
ER lumen ER membrane Golgi Mitochondrion PM
14 149 68 93 93
Plastid Ribosome TGN unknown vacuole
39 23 13 171 26
MSnSet (storageMode: lockedEnvironment)
assayData: 689 features, 16 samples
element names: exprs
protocolData: none
phenoData
sampleNames: M1F1A M1F4A ... M2F11B (16 total)
varLabels: membrane.prep fraction replicate
varMetadata: labelDescription
featureData
featureNames: AT1G09210 AT1G21750 ... AT4G39080 (689 total)
fvarLabels: assigned evidence ... nnet.pred (11 total)
fvarMetadata: labelDescription
experimentData: use 'experimentData(object)'
pubMedIds: 16618929
Annotation:
- - - Processing information - - -
Loaded on Thu Jul 16 22:53:08 2015.
Normalised to sum of intensities.
Added markers from 'mrk' marker vector. Thu Jul 16 22:53:08 2015
Performed nnet prediction (decay=0.1 size=5) Thu Jul 7 01:45:04 2016
Added nnet predictions according to global threshold = 0.75 Thu Jul 7 01:45:04 2016
MSnbase version: 1.17.12
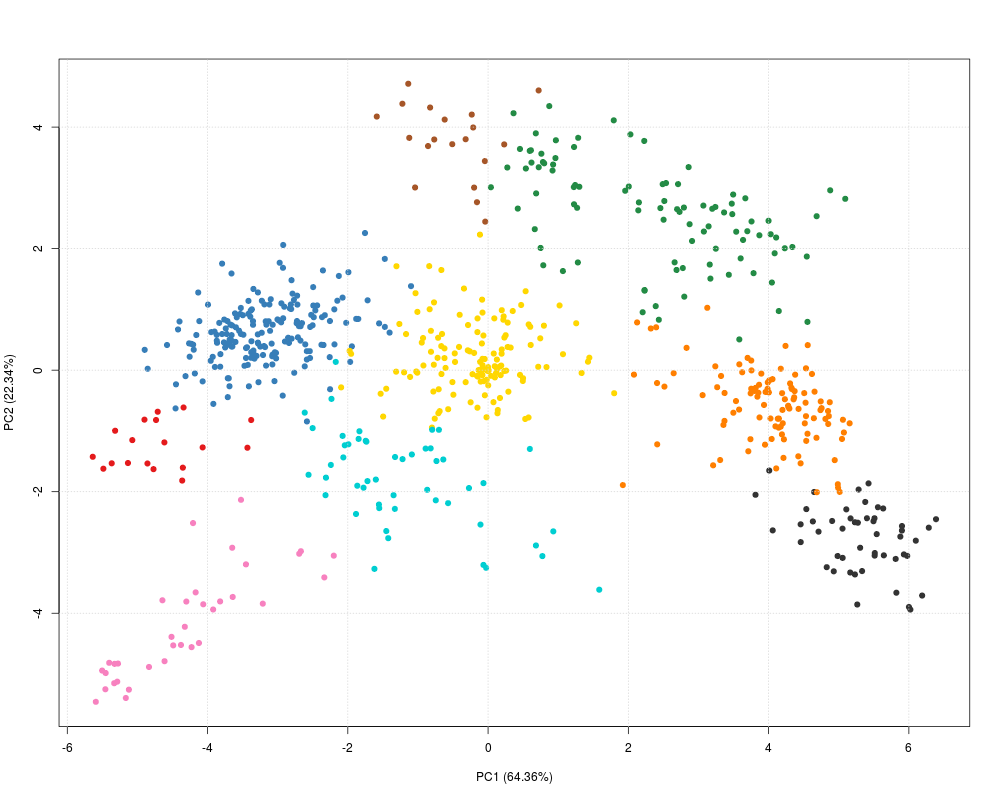
> plot2D(res, fcol = "nnet")
>
>
>
>
>
> dev.off()
null device
1
>
|
Created & Maintained by Osamu Ogasawara (osamu.ogasawara@gmail.com) and 