Supported by Dr. Osamu Ogasawara and  . . |
|
Last data update: 2014.03.03 |
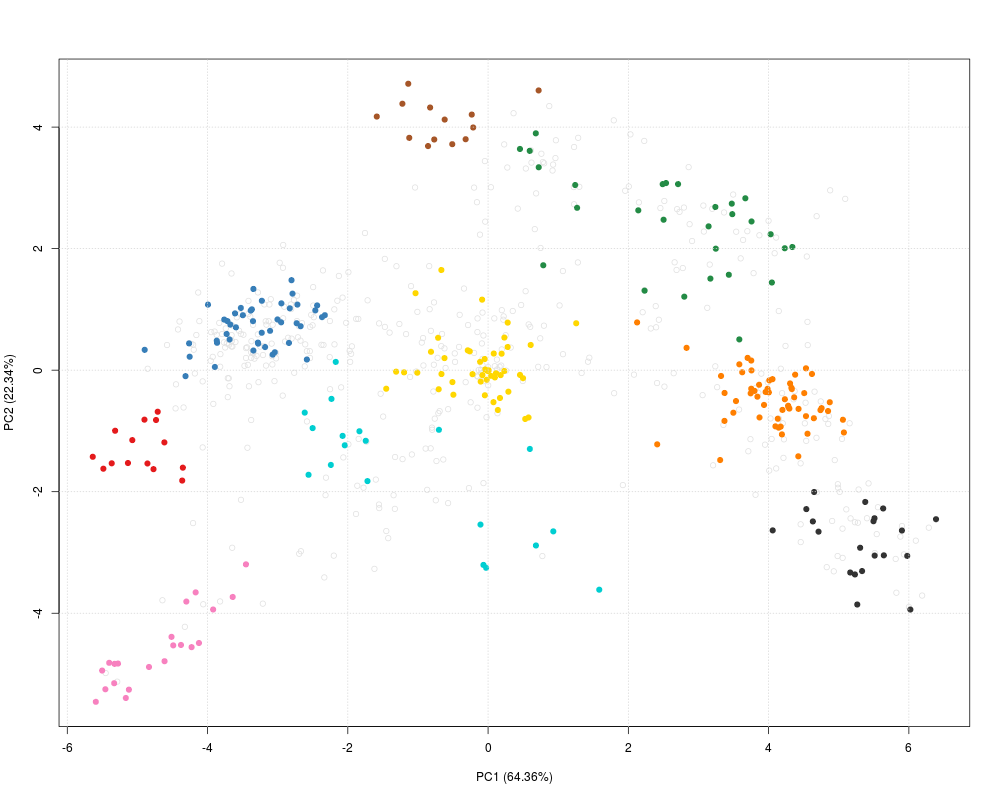
Plot organelle assignment data and results.DescriptionGenerate 2 dimensional or feature distribution plots to illustrate
localistation clusters. In Usageplot2D(object, fcol = "markers", fpch, unknown = "unknown", dims = 1:2, score = 1, method = "PCA", methargs, axsSwitch = FALSE, mirrorX = FALSE, mirrorY = FALSE, col, pch, cex, index = FALSE, idx.cex = 0.75, identify = FALSE, plot = TRUE, ...) Arguments
Details
ValueUsed for its side effects of generating a plot. Invisibly returns the 2d data. Author(s)Laurent Gatto <lg390@cam.ac.uk> See Also
Examples
library("pRolocdata")
data(dunkley2006)
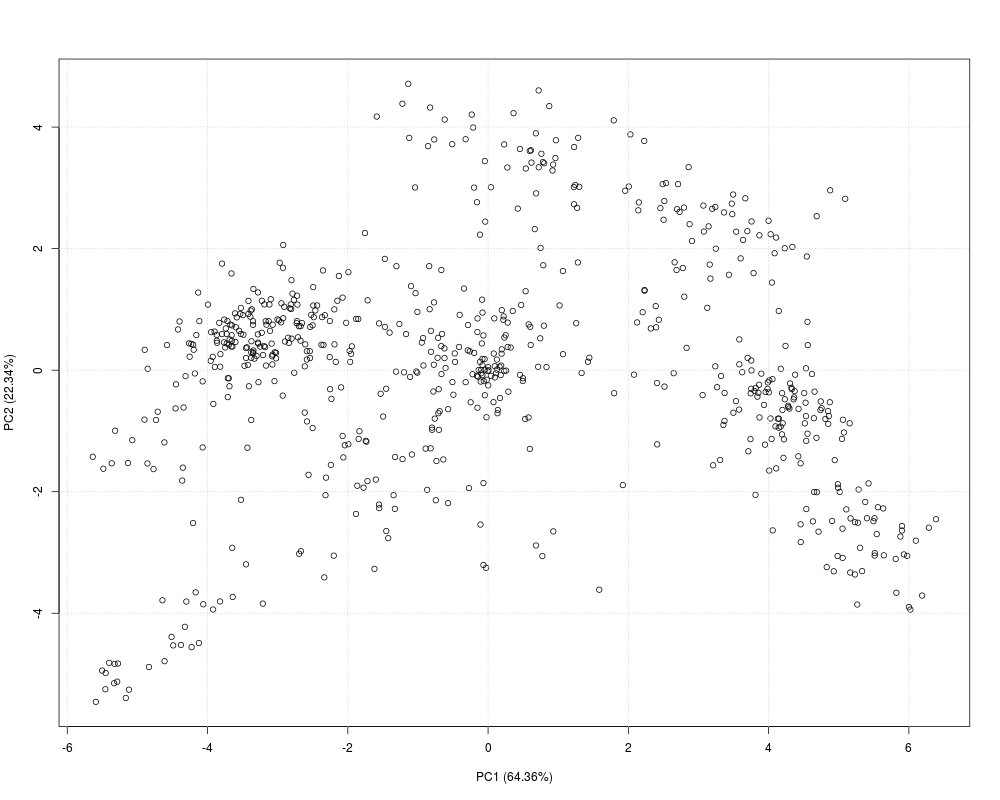
plot2D(dunkley2006, fcol = NULL)
## available methods
plot2Dmethods
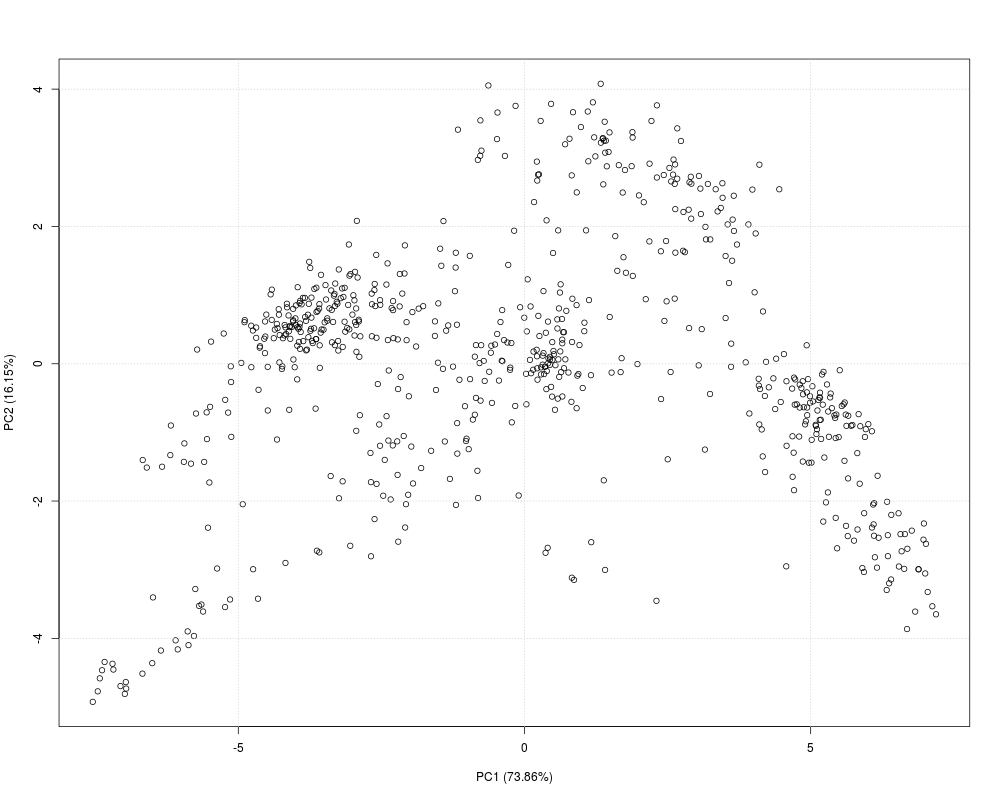
plot2D(dunkley2006, fcol = NULL, method = "kpca")
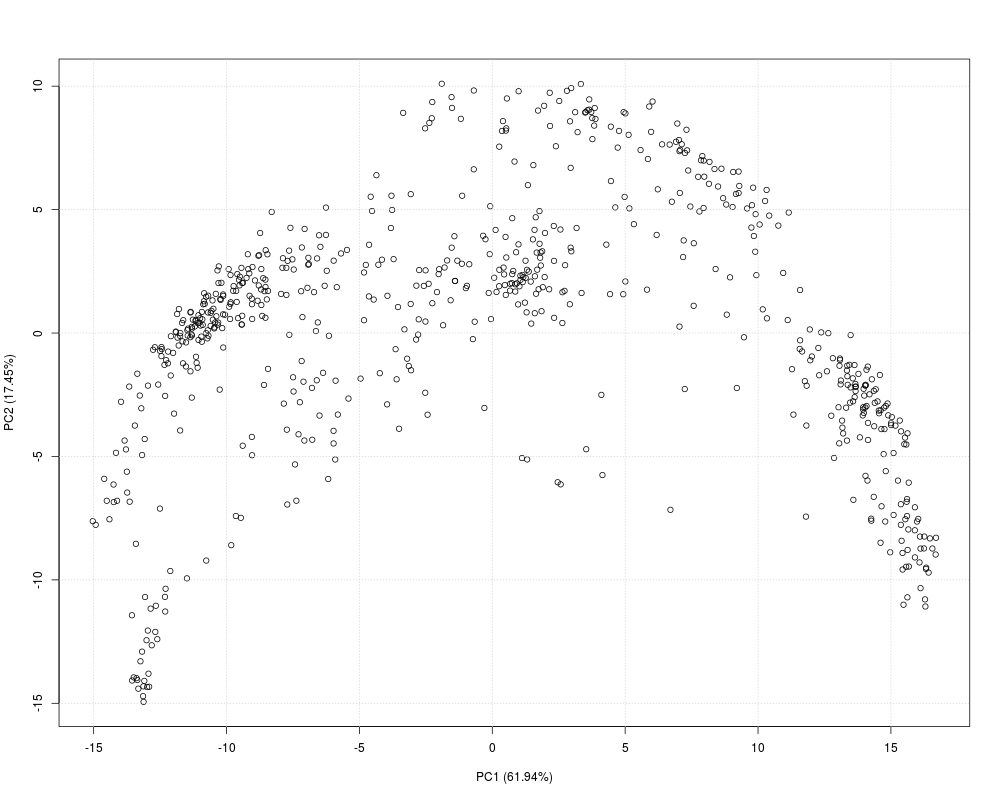
plot2D(dunkley2006, fcol = NULL, method = "kpca",
methargs = list(kpar = list(sigma = 1)))
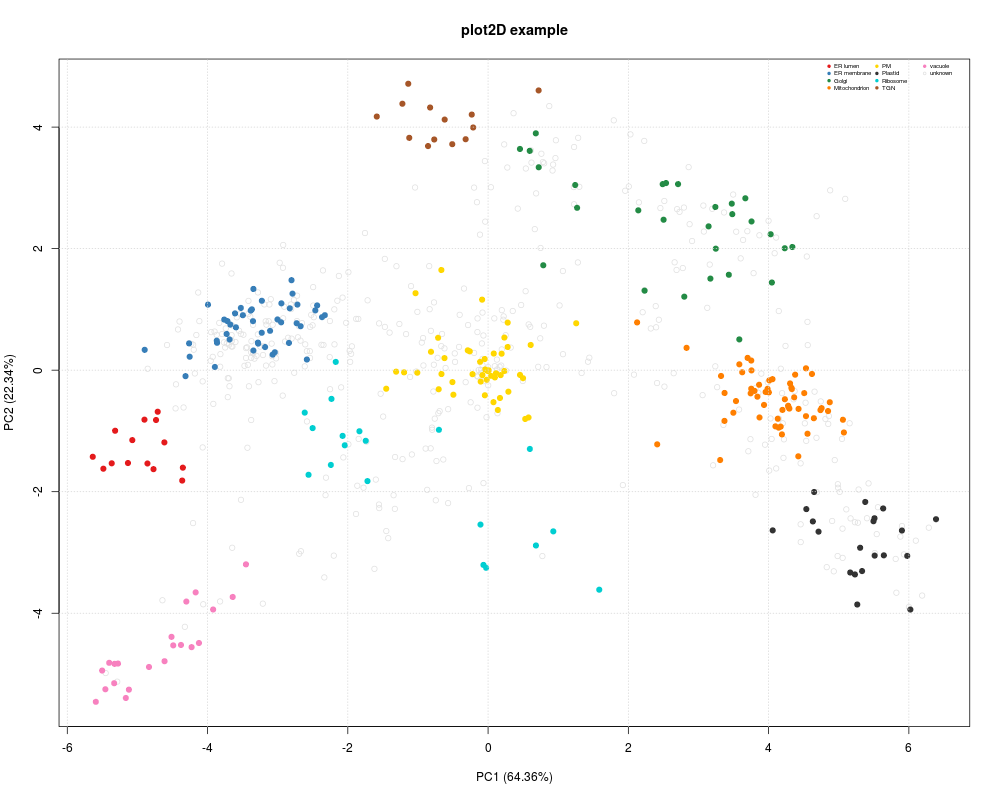
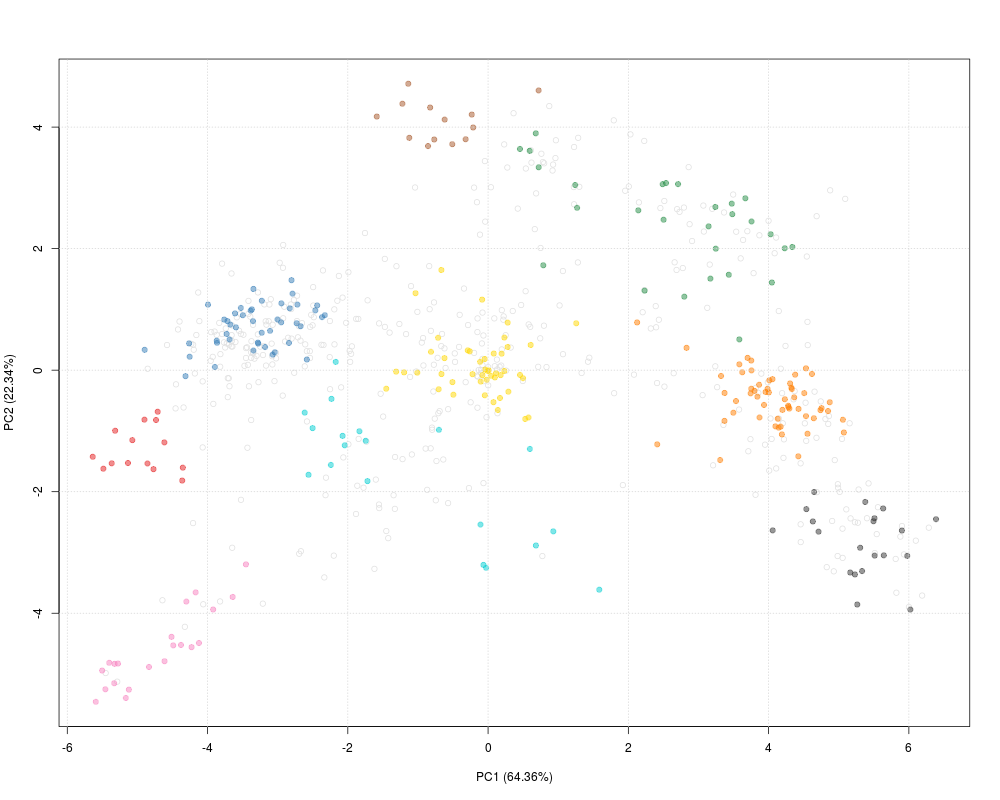
plot2D(dunkley2006, fcol = "markers")
addLegend(dunkley2006,
fcol = "markers",
where = "topright",
cex = 0.5, bty = "n", ncol = 3)
title(main = "plot2D example")
## Using transparent colours
setStockcol(paste0(getStockcol(), "80"))
plot2D(dunkley2006, fcol = "markers")
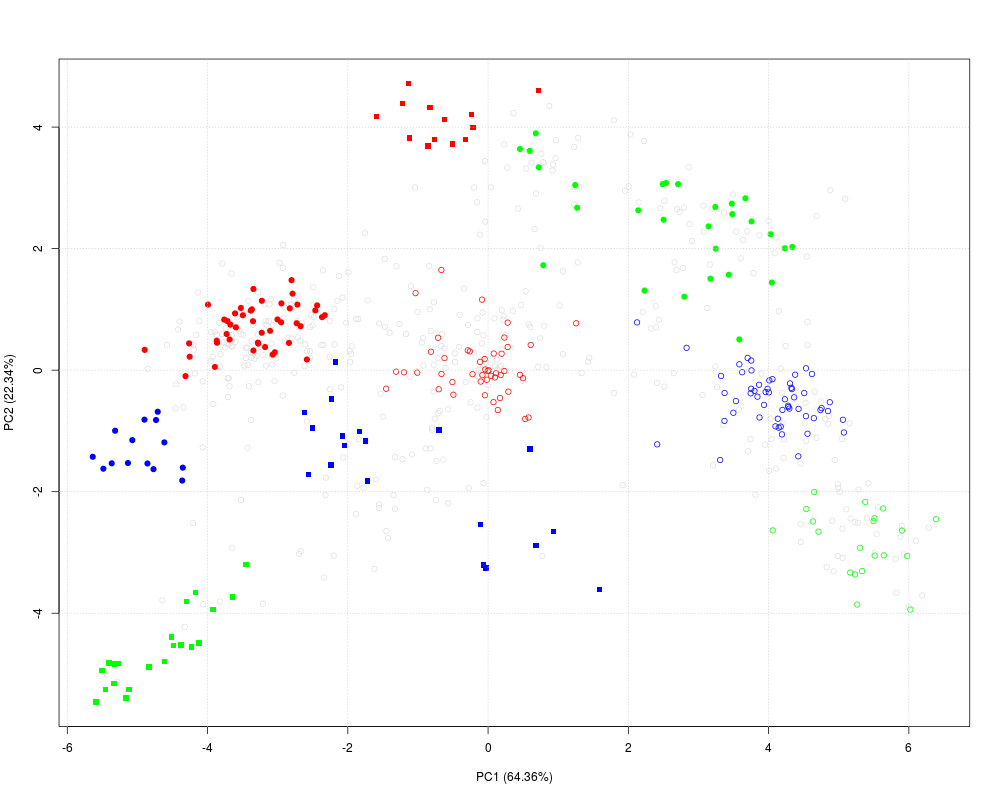
## New behavious in 1.3.6 when not enough colours
setStockcol(c("blue", "red", "green"))
getStockcol() ## only 3 colours to be recycled
getMarkers(dunkley2006)
plot2D(dunkley2006)
## reset colours
setStockcol(NULL)
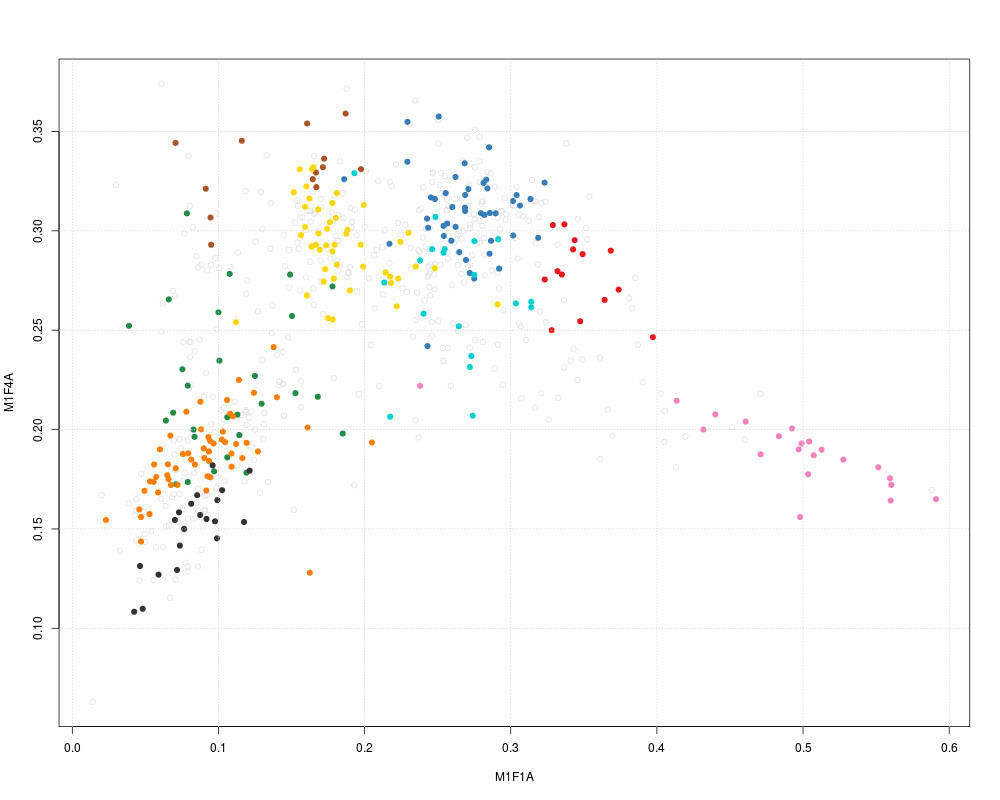
plot2D(dunkley2006, method = "none") ## plotting along 2 first fractions
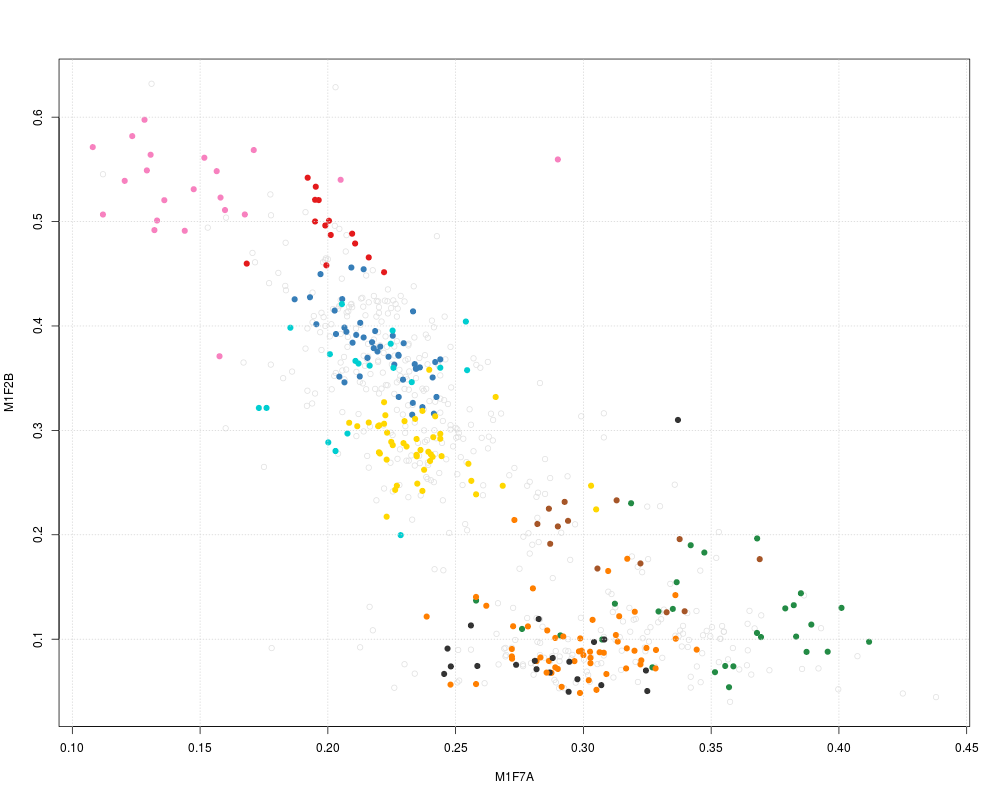
plot2D(dunkley2006, dims = c(3, 5), method = "none") ## plotting along fractions 3 and 5
## pre-calculate PC1 and PC2 coordinates
pca <- plot2D(dunkley2006, plot=FALSE)
head(pca)
plot2D(pca, method = "none", methargs = list(dunkley2006))
Results
R version 3.3.1 (2016-06-21) -- "Bug in Your Hair"
Copyright (C) 2016 The R Foundation for Statistical Computing
Platform: x86_64-pc-linux-gnu (64-bit)

R is free software and comes with ABSOLUTELY NO WARRANTY.
You are welcome to redistribute it under certain conditions.
Type 'license()' or 'licence()' for distribution details.

R is a collaborative project with many contributors.
Type 'contributors()' for more information and
'citation()' on how to cite R or R packages in publications.

Type 'demo()' for some demos, 'help()' for on-line help, or
'help.start()' for an HTML browser interface to help.
Type 'q()' to quit R.

> library(pRoloc)
Loading required package: MSnbase
Loading required package: BiocGenerics
Loading required package: parallel

Attaching package: 'BiocGenerics'

The following objects are masked from 'package:parallel':

    clusterApply, clusterApplyLB, clusterCall, clusterEvalQ,
    clusterExport, clusterMap, parApply, parCapply, parLapply,
    parLapplyLB, parRapply, parSapply, parSapplyLB

The following objects are masked from 'package:stats':

    IQR, mad, xtabs

The following objects are masked from 'package:base':

    Filter, Find, Map, Position, Reduce, anyDuplicated, append,
    as.data.frame, cbind, colnames, do.call, duplicated, eval, evalq,
    get, grep, grepl, intersect, is.unsorted, lapply, lengths, mapply,
    match, mget, order, paste, pmax, pmax.int, pmin, pmin.int, rank,
    rbind, rownames, sapply, setdiff, sort, table, tapply, union,
    unique, unsplit

Loading required package: Biobase
Welcome to Bioconductor

    Vignettes contain introductory material; view with
    'browseVignettes()'. To cite Bioconductor, see
    'citation("Biobase")', and for packages 'citation("pkgname")'.

Loading required package: mzR
Loading required package: Rcpp
Loading required package: BiocParallel
Loading required package: ProtGenerics

This is MSnbase version 1.20.7
  Read '?MSnbase' and references therein for information
  about the package and how to get started.


Attaching package: 'MSnbase'

The following object is masked from 'package:stats':

    smooth

The following object is masked from 'package:base':

    trimws

Loading required package: MLInterfaces
Loading required package: annotate
Loading required package: AnnotationDbi
Loading required package: stats4
Loading required package: IRanges
Loading required package: S4Vectors

Attaching package: 'S4Vectors'

The following objects are masked from 'package:base':

    colMeans, colSums, expand.grid, rowMeans, rowSums

Loading required package: XML
Loading required package: cluster

This is pRoloc version 1.12.4
  Read '?pRoloc' and references therein for information
  about the package and how to get started.

> png(filename="/home/ddbj/snapshot/RGM3/R_BC/result/pRoloc/plot2D.Rd_%03d_medium.png", width=480, height=480)
> ### Name: plot2D
> ### Title: Plot organelle assignment data and results.
> ### Aliases: plot2D plot2Dmethods
>
> ### ** Examples
>
> library("pRolocdata")

This is pRolocdata version 1.10.0.
Use 'pRolocdata()' to list available data sets.
> data(dunkley2006)
> plot2D(dunkley2006, fcol = NULL)
> ## available methods
> plot2Dmethods
[1] "PCA"   "MDS"   "kpca"  "t-SNE" "none"  "scree"
> plot2D(dunkley2006, fcol = NULL, method = "kpca")
> plot2D(dunkley2006, fcol = NULL, method = "kpca",
+        methargs = list(kpar = list(sigma = 1)))
> plot2D(dunkley2006, fcol = "markers")
> addLegend(dunkley2006,
+           fcol = "markers",
+           where = "topright",
+           cex = 0.5, bty = "n", ncol = 3)
> title(main = "plot2D example")
> ## Using transparent colours
> setStockcol(paste0(getStockcol(), "80"))
> plot2D(dunkley2006, fcol = "markers")
> ## New behavious in 1.3.6 when not enough colours
> setStockcol(c("blue", "red", "green"))
> getStockcol() ## only 3 colours to be recycled
[1] "blue"  "red"   "green"
> getMarkers(dunkley2006)
organelleMarkers
     ER lumen   ER membrane         Golgi Mitochondrion            PM
           14            45            28            55            46
      Plastid      Ribosome           TGN       unknown       vacuole
           20            19            13           428            21
> plot2D(dunkley2006)
Not enough colours: using colours and pch.
> ## reset colours
> setStockcol(NULL)
> plot2D(dunkley2006, method = "none") ## plotting along 2 first fractions
> plot2D(dunkley2006, dims = c(3, 5), method = "none") ## plotting along fractions 3 and 5
> ## pre-calculate PC1 and PC2 coordinates
> pca <- plot2D(dunkley2006, plot=FALSE)
> head(pca)
          PC1 (64.36%) PC2 (22.34%)
AT1G09210    -4.734261   -0.8204175
AT1G21750    -4.615276   -1.1891468
AT1G51760    -4.770573   -1.6292717
AT1G56340    -5.318056   -0.9972462
AT2G32920    -5.135122   -1.5283630
AT2G47470    -4.899410   -0.8145343
> plot2D(pca, method = "none", methargs  = list(dunkley2006))
>
>
>
>
>
> dev.off()
null device
          1
>
|