A character, numeric or
logical of appropriate length and or content used to
subset object and define the organelle markers.
mcol
A character define the colour of the marker
features. Default is "steelblue".
pcol
A character define the colour of the
non-markers features. Default is "grey90".
alpha
A numeric defining the alpha channel (transparency)
of the points, where 0 <= alpha <= 1, 0 and 1 being
completely transparent and opaque.
type
Character string defining the type of lines. For
example "p" for points, "l" for lines,
"b" for both. See plot for all possible types.
lty
Vector of line types for the marker profiles. Default
is 1 (solid). See par for details.
fractions
An optional character defining the
phenoData variable to be used to label the fraction
along the x axis. If missing, the phenoData variables
are searched for a match to fraction. If no match is
found, the fractions are labelled as numericals.
ylim
A numeric vector of length 2, giving the y coordinates
range.
...
Additional parameters passed to plot.
Value
Used for its side effect of producing a feature
distribution plot. Invisibly returns the data matrix.
R version 3.3.1 (2016-06-21) -- "Bug in Your Hair"
Copyright (C) 2016 The R Foundation for Statistical Computing
Platform: x86_64-pc-linux-gnu (64-bit)
R is free software and comes with ABSOLUTELY NO WARRANTY.
You are welcome to redistribute it under certain conditions.
Type 'license()' or 'licence()' for distribution details.
R is a collaborative project with many contributors.
Type 'contributors()' for more information and
'citation()' on how to cite R or R packages in publications.
Type 'demo()' for some demos, 'help()' for on-line help, or
'help.start()' for an HTML browser interface to help.
Type 'q()' to quit R.
> library(pRoloc)
Loading required package: MSnbase
Loading required package: BiocGenerics
Loading required package: parallel
Attaching package: 'BiocGenerics'
The following objects are masked from 'package:parallel':
clusterApply, clusterApplyLB, clusterCall, clusterEvalQ,
clusterExport, clusterMap, parApply, parCapply, parLapply,
parLapplyLB, parRapply, parSapply, parSapplyLB
The following objects are masked from 'package:stats':
IQR, mad, xtabs
The following objects are masked from 'package:base':
Filter, Find, Map, Position, Reduce, anyDuplicated, append,
as.data.frame, cbind, colnames, do.call, duplicated, eval, evalq,
get, grep, grepl, intersect, is.unsorted, lapply, lengths, mapply,
match, mget, order, paste, pmax, pmax.int, pmin, pmin.int, rank,
rbind, rownames, sapply, setdiff, sort, table, tapply, union,
unique, unsplit
Loading required package: Biobase
Welcome to Bioconductor
Vignettes contain introductory material; view with
'browseVignettes()'. To cite Bioconductor, see
'citation("Biobase")', and for packages 'citation("pkgname")'.
Loading required package: mzR
Loading required package: Rcpp
Loading required package: BiocParallel
Loading required package: ProtGenerics
This is MSnbase version 1.20.7
Read '?MSnbase' and references therein for information
about the package and how to get started.
Attaching package: 'MSnbase'
The following object is masked from 'package:stats':
smooth
The following object is masked from 'package:base':
trimws
Loading required package: MLInterfaces
Loading required package: annotate
Loading required package: AnnotationDbi
Loading required package: stats4
Loading required package: IRanges
Loading required package: S4Vectors
Attaching package: 'S4Vectors'
The following objects are masked from 'package:base':
colMeans, colSums, expand.grid, rowMeans, rowSums
Loading required package: XML
Loading required package: cluster
This is pRoloc version 1.12.4
Read '?pRoloc' and references therein for information
about the package and how to get started.
> png(filename="/home/ddbj/snapshot/RGM3/R_BC/result/pRoloc/plotDist.Rd_%03d_medium.png", width=480, height=480)
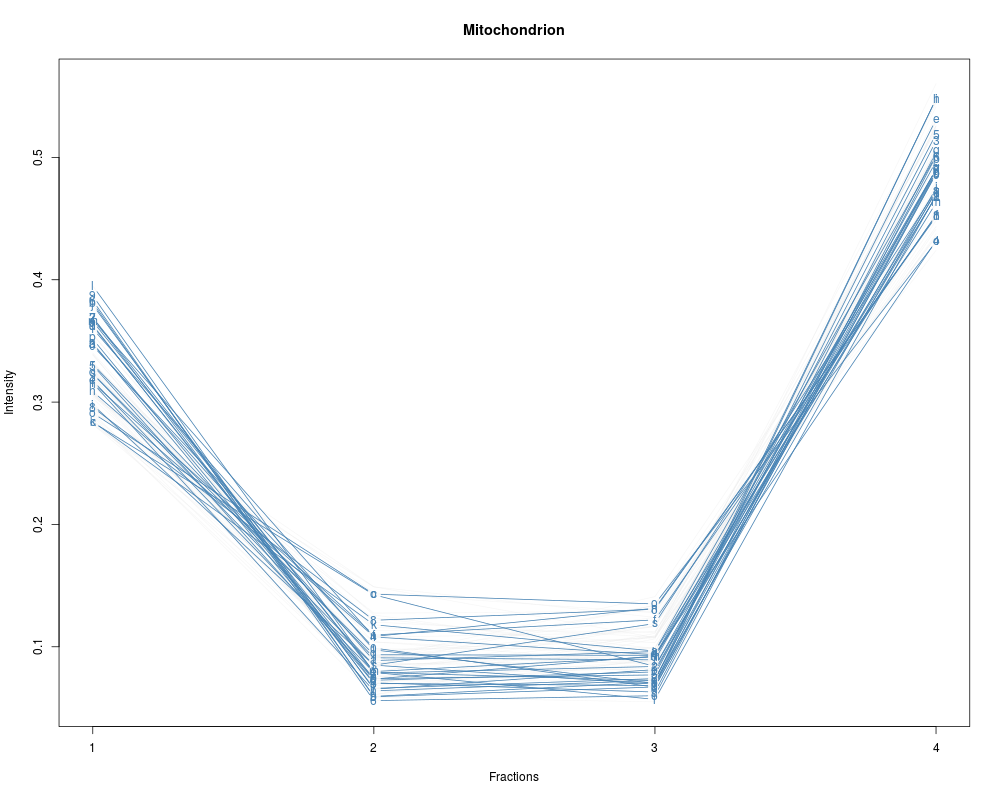
> ### Name: plotDist
> ### Title: Plots the distribution of features across fractions
> ### Aliases: plotDist
>
> ### ** Examples
>
> library("pRolocdata")
This is pRolocdata version 1.10.0.
Use 'pRolocdata()' to list available data sets.
> data(tan2009r1)
> j <- which(fData(tan2009r1)$markers == "mitochondrion")
> i <- which(fData(tan2009r1)$PLSDA == "mitochondrion")
> plotDist(tan2009r1[i, ],
+ markers = featureNames(tan2009r1)[j])
> title("Mitochondrion")
>
>
>
>
>
> dev.off()
null device
1
>
 .
.