Supported by Dr. Osamu Ogasawara and  . . |
|
Last data update: 2014.03.03 |
Perform principal component analysisDescriptionPerform PCA on a numeric matrix for visualisation, information extraction and missing value imputation. Usage
pca(object, method, nPcs = 2, scale = c("none", "pareto", "vector", "uv"),
  center = TRUE, completeObs = TRUE, subset = NULL, cv = c("none",
  "q2"), ...)
Arguments
DetailsThis method is wrapper function for the following set of pca methods:
Scaling and centering is part of the PCA model and handled by
ValueA Author(s)Wolfram Stacklies, Henning Redestig ReferencesWold, H. (1966) Estimation of principal components and related models by iterative least squares. In Multivariate Analysis (Ed., P.R. Krishnaiah), Academic Press, NY, 391-420. Shigeyuki Oba, Masa-aki Sato, Ichiro Takemasa, Morito Monden, Ken-ichi Matsubara and Shin Ishii. A Bayesian missing value estimation method for gene expression profile data. Bioinformatics, 19(16):2088-2096, Nov 2003. Troyanskaya O. and Cantor M. and Sherlock G. and Brown P. and Hastie T. and Tibshirani R. and Botstein D. and Altman RB. - Missing value estimation methods for DNA microarrays. Bioinformatics. 2001 Jun;17(6):520-5. See Also
Examples
data(iris)
## Usually some kind of scaling is appropriate
pcIr <- pca(iris, method="svd", nPcs=2)
pcIr <- pca(iris, method="nipals", nPcs=3, cv="q2")
## Get a short summary on the calculated model
summary(pcIr)
plot(pcIr)
## Scores and loadings plot
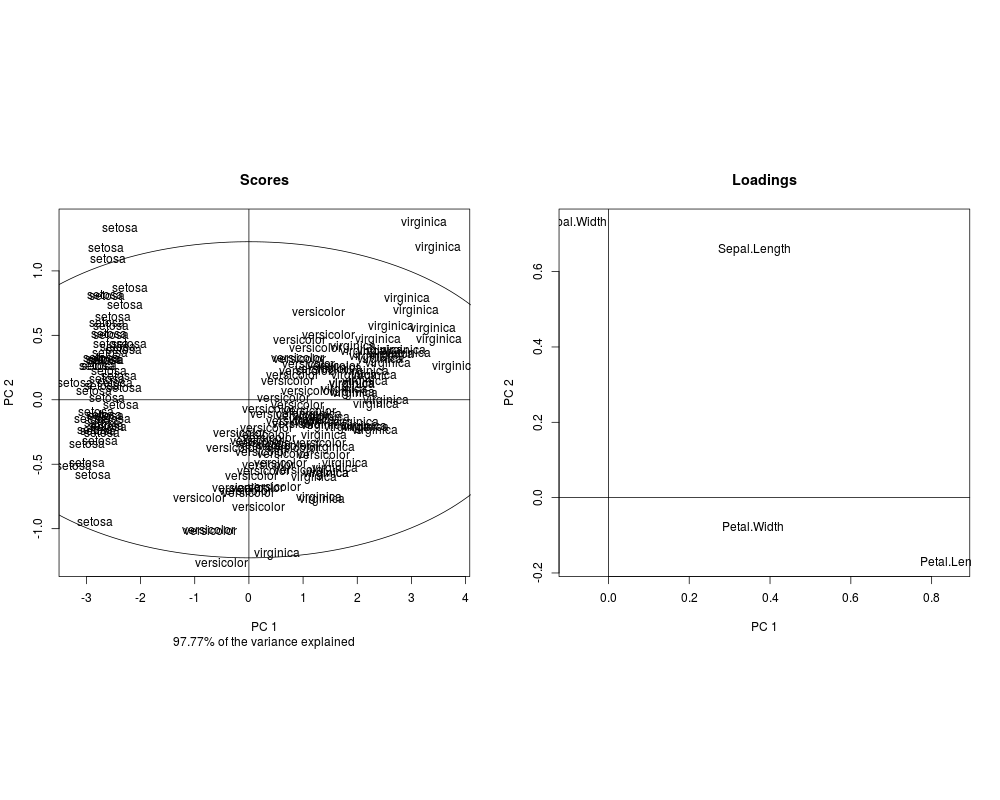
slplot(pcIr, sl=as.character(iris[,5]))
## use an expressionset and ggplot
data(sample.ExpressionSet)
pc <- pca(sample.ExpressionSet)
df <- merge(scores(pc), pData(sample.ExpressionSet), by=0)
library(ggplot2)
ggplot(df, aes(PC1, PC2, shape=sex, color=type)) +
geom_point() +
xlab(paste("PC1", pc@R2[1] * 100, "% of variance")) +
ylab(paste("PC2", pc@R2[2] * 100, "% of variance"))
Results
R version 3.3.1 (2016-06-21) -- "Bug in Your Hair"
Copyright (C) 2016 The R Foundation for Statistical Computing
Platform: x86_64-pc-linux-gnu (64-bit)

R is free software and comes with ABSOLUTELY NO WARRANTY.
You are welcome to redistribute it under certain conditions.
Type 'license()' or 'licence()' for distribution details.

R is a collaborative project with many contributors.
Type 'contributors()' for more information and
'citation()' on how to cite R or R packages in publications.

Type 'demo()' for some demos, 'help()' for on-line help, or
'help.start()' for an HTML browser interface to help.
Type 'q()' to quit R.

> library(pcaMethods)
Loading required package: Biobase
Loading required package: BiocGenerics
Loading required package: parallel

Attaching package: 'BiocGenerics'

The following objects are masked from 'package:parallel':

    clusterApply, clusterApplyLB, clusterCall, clusterEvalQ,
    clusterExport, clusterMap, parApply, parCapply, parLapply,
    parLapplyLB, parRapply, parSapply, parSapplyLB

The following objects are masked from 'package:stats':

    IQR, mad, xtabs

The following objects are masked from 'package:base':

    Filter, Find, Map, Position, Reduce, anyDuplicated, append,
    as.data.frame, cbind, colnames, do.call, duplicated, eval, evalq,
    get, grep, grepl, intersect, is.unsorted, lapply, lengths, mapply,
    match, mget, order, paste, pmax, pmax.int, pmin, pmin.int, rank,
    rbind, rownames, sapply, setdiff, sort, table, tapply, union,
    unique, unsplit

Welcome to Bioconductor

    Vignettes contain introductory material; view with
    'browseVignettes()'. To cite Bioconductor, see
    'citation("Biobase")', and for packages 'citation("pkgname")'.


Attaching package: 'pcaMethods'

The following object is masked from 'package:stats':

    loadings

> png(filename="/home/ddbj/snapshot/RGM3/R_BC/result/pcaMethods/pca.Rd_%03d_medium.png", width=480, height=480)
> ### Name: pca
> ### Title: Perform principal component analysis
> ### Aliases: pca
> ### Keywords: multivariate
>
> ### ** Examples
>
> data(iris)
> ##  Usually some kind of scaling is appropriate
> pcIr <- pca(iris, method="svd", nPcs=2)
> pcIr <- pca(iris, method="nipals", nPcs=3, cv="q2")
> ## Get a short summary on the calculated model
> summary(pcIr)
nipals calculated PCA
Importance of component(s):
                 PC1     PC2    PC3
R2            0.9246 0.05307 0.0171
Cumulative R2 0.9246 0.97769 0.9948
> plot(pcIr)
> ## Scores and loadings plot
> slplot(pcIr, sl=as.character(iris[,5]))
>
> ## use an expressionset and ggplot
> data(sample.ExpressionSet)
> pc <- pca(sample.ExpressionSet)
> df <- merge(scores(pc), pData(sample.ExpressionSet), by=0)
> library(ggplot2)
> ggplot(df, aes(PC1, PC2, shape=sex, color=type)) +
+   geom_point() +
+   xlab(paste("PC1", pc@R2[1] * 100, "% of variance")) +
+   ylab(paste("PC2", pc@R2[2] * 100, "% of variance"))
>
>
>
>
>
> dev.off()
null device
          1
>
|