S4 class for storing the result of an association
test performed on multiple genomic regions
Objects
Objects of this class are created by calling assocTest
with a non-empty ranges argument.
Slots
This class extends the class GRanges directly and
therefore inherits all its slots and methods.
The following slots are defined for AssocTestResultRanges objects
additionally:
type:
type of null model on which the association test
was based
samples:
character vector with sample names (if
available, otherwise empty)
kernel:
kernel that was used for the association test
weights:
weight vector or weighting function that was
used; NULL if no weighting was performed
width:
tolerance radius parameter that was used for
position-dependent kernels
adj.method:
which method for multiple testing correction
has been applied (if any)
vcfParams:
list of parameters that were used for reading
genotypes from VCF file
sex:
factor with sex information (if any)
call:
the matched call with which the object was created
Apart from these additional slots, all AssocTestResultRanges
objects have particular metadata columns (accessible via
mcols or elementMetadata):
n:
number of variants tested in each region; a zero
does not necessarily mean that there were no variants in this region, it
only means that no variants were used for testing. Variants are
omitted from the test if they do not show any variation or if they
do not satisfy other filter criteria applied by
assocTest. This metadata column is always present.
Q:
test statistic for each region that was tested. This
metadata column is always present.
p.value:
p-value of test for each region that was tested. This
metadata column is always present.
p.value.adj:
adjusted p-value of test for each region
that was tested. This metadata column is only present if multiple
testing correction has been applied (see p.adjust).
p.value.resampled:
estimated p-value computed as
the relative frequency of p-values of sampled residuals that
are at least as significant as the test's p-value in each region.
This metadata column is only present if resampling has been applied,
i.e. if assocTest has been called with
n.resampling greater than zero.
p.value.resampled.adj:
adjusted empirical p-value (see above).
This metadata column is only present if resampling and multiple
testing correction has been applied.
Methods
c
signature(object="AssocTestResultRanges"):
allows for concatenating two or more AssocTestResultRanges
objects; this is only meaningful if the different tests have been
performed on the same samples, on the same genome, with the same
kernel, and with the same VCF reading parameters (in case that the
association test has been performed directly on a VCF file).
All these conditions are checked and if any of them is not
fulfilled, the method quits with an error. Merging association
test results that were computed with different sex
parameters is possible, but the sex component is omitted
and a warning is issued. Note that multiple
testing correction (see p.adjust) should not be
carried out on parts, but only on the entire set of all tests.
That is why c strips off all adjusted p-values.
p.adjust
signature(object="AssocTestResultRanges"):
multiple testing correction, see
p.adjust.
filterResult
signature(object="AssocTestResultRanges"):
apply filtering to p-values or adjusted p-values. For more
details, see filterResult.
sort
signature(object="AssocTestResultRanges"):
sort AssocTestResultRanges object according to specified
sorting criterion. See sort
for more details.
plot
signature(object="AssocTestResultRanges"):
make a Manhattan plot of the association test result.
See plot for more details.
qqplot
signature(object="AssocTestResultRanges"):
make quantile-quantile (Q-Q) plot of association test result.
See qqplot for more details.
show
signature(object="AssocTestResultRanges"):
displays some general information about the result of the
association test, such as, the number of samples, the number of
regions tested, the number of regions without variants, the average
number of variants in the tested regions, the genome, the kernel that
was applied, and the type of multiple testing correction (if any).
print
signature(x="AssocTestResultRanges"):
allows for displaying more information about the object than
show. See print
for more details.
Accessors and subsetting
As mentioned above, the AssocTestResultRanges inherits all
methods from the GRanges class.
## load genome description
data(hgA)
## partition genome into overlapping windows
windows <- partitionRegions(hgA)
## load genotype data from VCF file
vcfFile <- system.file("examples/example1.vcf.gz", package="podkat")
Z <- readGenotypeMatrix(vcfFile)
## read phenotype data from CSV file (continuous trait + covariates)
phenoFile <- system.file("examples/example1lin.csv", package="podkat")
pheno <-read.table(phenoFile, header=TRUE, sep=",")
## train null model with all covariates in data frame 'pheno'
nm.lin <- nullModel(y ~ ., pheno)
## perform association test for multiple regions
res <- assocTest(Z, nm.lin, windows)
## perform multiple testing correction
res.adj <- p.adjust(res)
print(res.adj)
## show sorted results
as(sort(res.adj), "GRanges")
## show filtered result
print(filterResult(res.adj, cutoff=0.05, filterBy="p.value.adj"))
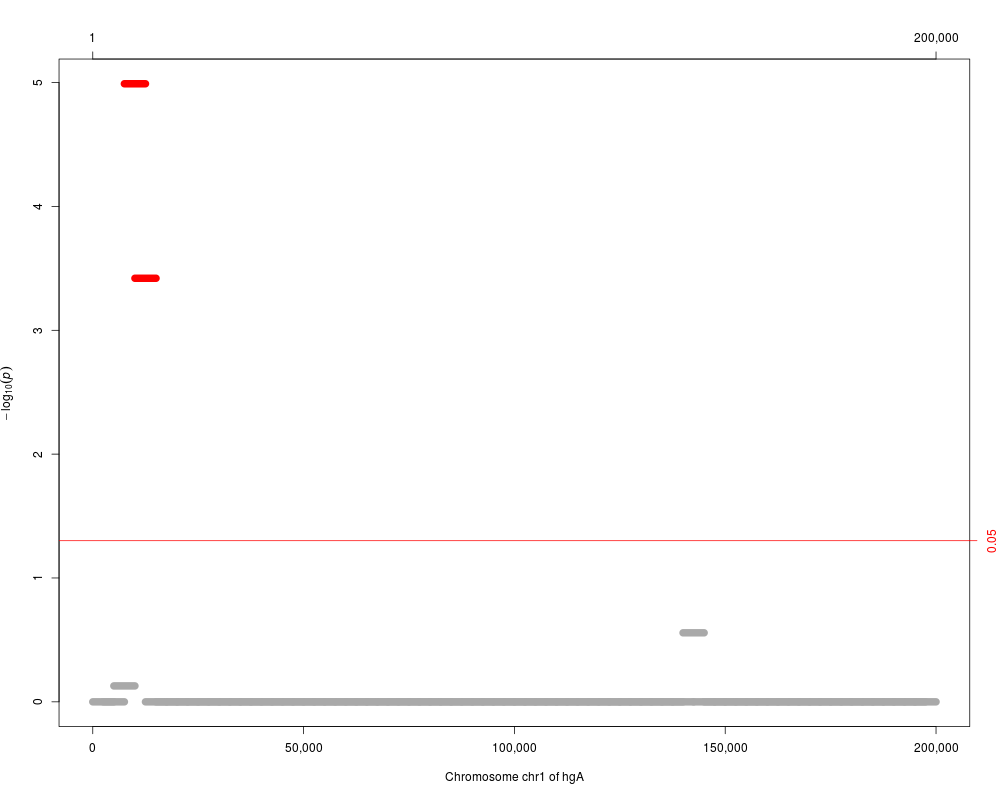
## make a Manhattan plot
plot(res.adj, which="p.value.adj")
Results
R version 3.3.1 (2016-06-21) -- "Bug in Your Hair"
Copyright (C) 2016 The R Foundation for Statistical Computing
Platform: x86_64-pc-linux-gnu (64-bit)

R is free software and comes with ABSOLUTELY NO WARRANTY.
You are welcome to redistribute it under certain conditions.
Type 'license()' or 'licence()' for distribution details.

R is a collaborative project with many contributors.
Type 'contributors()' for more information and
'citation()' on how to cite R or R packages in publications.

Type 'demo()' for some demos, 'help()' for on-line help, or
'help.start()' for an HTML browser interface to help.
Type 'q()' to quit R.

> library(podkat)
Loading required package: Rsamtools
Loading required package: GenomeInfoDb
Loading required package: stats4
Loading required package: BiocGenerics
Loading required package: parallel

Attaching package: 'BiocGenerics'

The following objects are masked from 'package:parallel':

    clusterApply, clusterApplyLB, clusterCall, clusterEvalQ,
    clusterExport, clusterMap, parApply, parCapply, parLapply,
    parLapplyLB, parRapply, parSapply, parSapplyLB

The following objects are masked from 'package:stats':

    IQR, mad, xtabs

The following objects are masked from 'package:base':

    Filter, Find, Map, Position, Reduce, anyDuplicated, append,
    as.data.frame, cbind, colnames, do.call, duplicated, eval, evalq,
    get, grep, grepl, intersect, is.unsorted, lapply, lengths, mapply,
    match, mget, order, paste, pmax, pmax.int, pmin, pmin.int, rank,
    rbind, rownames, sapply, setdiff, sort, table, tapply, union,
    unique, unsplit

Loading required package: S4Vectors

Attaching package: 'S4Vectors'

The following objects are masked from 'package:base':

    colMeans, colSums, expand.grid, rowMeans, rowSums

Loading required package: IRanges
Loading required package: GenomicRanges
Loading required package: Biostrings
Loading required package: XVector
> png(filename="/home/ddbj/snapshot/RGM3/R_BC/result/podkat/AssocTestResultRanges-class.Rd_%03d_medium.png", width=480, height=480)
> ### Name: AssocTestResultRanges-class
> ### Title: Class 'AssocTestResultRanges'
> ### Aliases: AssocTestResultRanges-class class:AssocTestResultRanges
> ###   AssocTestResultRanges show,AssocTestResultRanges-method
> ###   c,AssocTestResultRanges-method
> ### Keywords: classes
>
> ### ** Examples
>
> ## load genome description
> data(hgA)
>
> ## partition genome into overlapping windows
> windows <- partitionRegions(hgA)
>
> ## load genotype data from VCF file
> vcfFile <- system.file("examples/example1.vcf.gz", package="podkat")
> Z <- readGenotypeMatrix(vcfFile)
>
> ## read phenotype data from CSV file (continuous trait + covariates)
> phenoFile <- system.file("examples/example1lin.csv", package="podkat")
> pheno <-read.table(phenoFile, header=TRUE, sep=",")
>
> ## train null model with all covariates in data frame 'pheno'
> nm.lin <- nullModel(y ~ ., pheno)
>
> ## perform association test for multiple regions
> res <- assocTest(Z, nm.lin, windows)
>
> ## perform multiple testing correction
> res.adj <- p.adjust(res)
> print(res.adj)
Overview of association test:
	Null model: linear
	Number of samples: 200
	Number of regions: 79
	Number of regions without variants: 0
	Average number of variants in regions: 24.1
	Genome: hgA
	Kernel: linear.podkat
	p-value adjustment: holm

Overview of significance of results:
	Number of tests with p < 0.05: 8
	Number of tests with adj. p < 0.05: 2

Results for the 8 most significant regions:
  seqnames  start    end width  n         Q      p.value  p.value.adj
1     chr1   7501  12500  5000 31 769748.34 1.294084e-07 1.022327e-05
2     chr1  10001  15000  5000 33 764828.81 4.874460e-06 3.802079e-04
3     chr1 140001 145000  5000 15  79937.68 3.599077e-03 2.771289e-01
4     chr1   5001  10000  5000 34 152555.30 9.785569e-03 7.437033e-01
5     chr1 132501 137500  5000 21  89287.55 1.349559e-02 1.000000e+00
6     chr1 142501 147500  5000 23  94629.68 3.338620e-02 1.000000e+00
7     chr1  42501  47500  5000 19  58191.23 3.341032e-02 1.000000e+00
8     chr1  25001  30000  5000 23 103713.12 3.754557e-02 1.000000e+00
>
> ## show sorted results
> as(sort(res.adj), "GRanges")
GRanges object with 79 ranges and 4 metadata columns:
       seqnames           ranges strand |         n                Q
          <Rle>        <IRanges>  <Rle> | <numeric>        <numeric>
   [1]     chr1 [  7501,  12500]      * |        31 769748.340179822
   [2]     chr1 [ 10001,  15000]      * |        33 764828.807281086
   [3]     chr1 [140001, 145000]      * |        15 79937.6762420402
   [4]     chr1 [  5001,  10000]      * |        34 152555.303827708
   [5]     chr1 [132501, 137500]      * |        21 89287.5494861112
   ...      ...              ...    ... .       ...              ...
  [75]     chr1 [ 27501,  32500]      * |        27 11390.8695299803
  [76]     chr1 [190001, 195000]      * |        31 13118.1746632318
  [77]     chr1 [ 30001,  35000]      * |        32  12375.113995621
  [78]     chr1 [ 67501,  72500]      * |        24 5108.22965981145
  [79]     chr1 [ 72501,  77500]      * |        35 7729.80454756586
                    p.value          p.value.adj
                  <numeric>            <numeric>
   [1] 1.29408445403989e-07 1.02232671869151e-05
   [2] 4.87446024721727e-06 0.000380207899282947
   [3]  0.00359907710181462    0.277128936839726
   [4]  0.00978556922534179    0.743703261125976
   [5]   0.0134955880226799                    1
   ...                  ...                  ...
  [75]    0.915114379698499                    1
  [76]    0.918458420094276                    1
  [77]    0.925860830198143                    1
  [78]    0.934396307634481                    1
  [79]    0.970955301862962                    1
  -------
  seqinfo: 1 sequence from hgA genome
>
> ## show filtered result
> print(filterResult(res.adj, cutoff=0.05, filterBy="p.value.adj"))
Overview of association test:
	Null model: linear
	Number of samples: 200
	Number of regions: 2
	Number of regions without variants: 0
	Average number of variants in regions: 32.0
	Genome: hgA
	Kernel: linear.podkat
	p-value adjustment: holm

Overview of significance of results:
	Number of tests with p < 0.05: 2
	Number of tests with adj. p < 0.05: 2

Results for the 2 most significant regions:
  seqnames start   end width  n        Q      p.value  p.value.adj
1     chr1  7501 12500  5000 31 769748.3 1.294084e-07 1.022327e-05
2     chr1 10001 15000  5000 33 764828.8 4.874460e-06 3.802079e-04
>
> ## make a Manhattan plot
> plot(res.adj, which="p.value.adj")
>
>
>
>
>
> dev.off()
null device
          1
>
 .
.