Supported by Dr. Osamu Ogasawara and  . . |
|
Last data update: 2014.03.03 |
PODKAT PackageDescriptionThis package provides an association test that is capable of dealing with very rare and even private variants. This is accomplished by a kernel-based approach that takes the positions of the variants into account. The test can be used for pre-processed matrix data, but also directly for variant data stored in VCF files. Association testing can be performed whole-genome, whole-exome, or restricted to pre-defined regions of interest. The test is complemented by tools for analyzing and visualizing the results. DetailsThe central method of this package is Author(s)Ulrich Bodenhofer bodenhofer@bioinf.jku.at Referenceshttp://www.bioinf.jku.at/software/podkat Examples
## load genome description
data(hgA)
## partition genome into overlapping windows
windows <- partitionRegions(hgA)
## load genotype data from VCF file
vcfFile <- system.file("examples/example1.vcf.gz", package="podkat")
Z <- readGenotypeMatrix(vcfFile)
## read phenotype data from CSV file (continuous trait + covariates)
phenoFile <- system.file("examples/example1lin.csv", package="podkat")
pheno <-read.table(phenoFile, header=TRUE, sep=",")
## train null model with all covariates in data frame 'pheno'
nm.lin <- nullModel(y ~ ., pheno)
## perform association test
res <- assocTest(Z, nm.lin, windows)
## display results
print(res)
print(p.adjust(res))
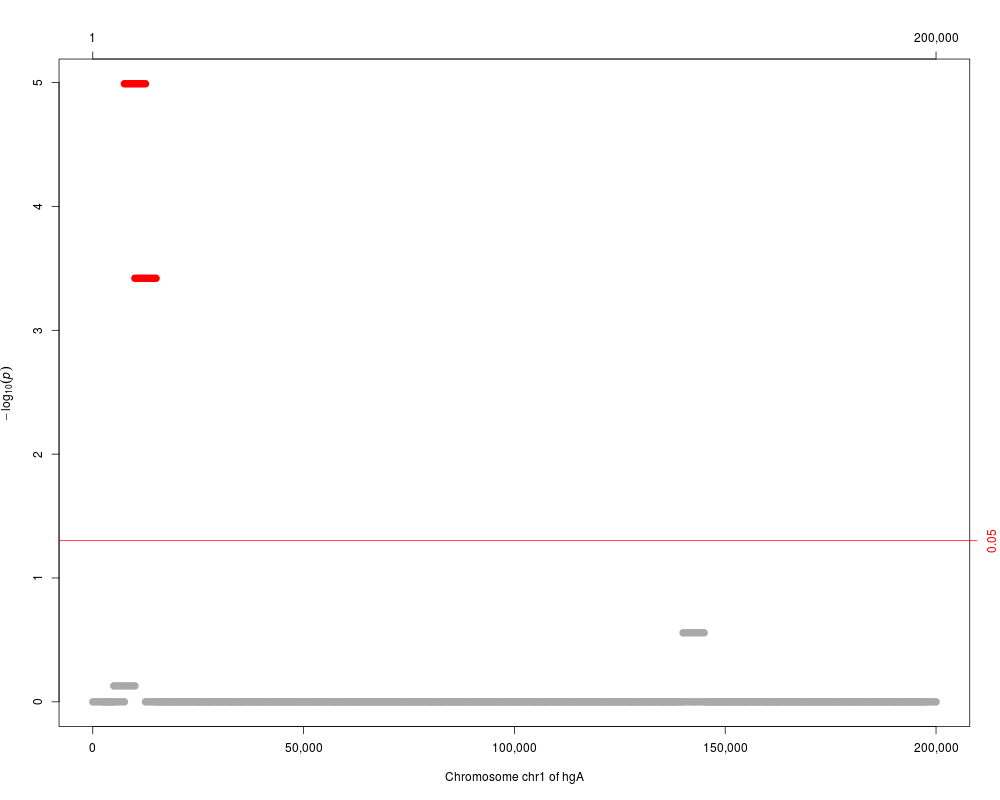
plot(p.adjust(res), which="p.value.adj")
Results
R version 3.3.1 (2016-06-21) -- "Bug in Your Hair"
Copyright (C) 2016 The R Foundation for Statistical Computing
Platform: x86_64-pc-linux-gnu (64-bit)

R is free software and comes with ABSOLUTELY NO WARRANTY.
You are welcome to redistribute it under certain conditions.
Type 'license()' or 'licence()' for distribution details.

R is a collaborative project with many contributors.
Type 'contributors()' for more information and
'citation()' on how to cite R or R packages in publications.

Type 'demo()' for some demos, 'help()' for on-line help, or
'help.start()' for an HTML browser interface to help.
Type 'q()' to quit R.

> library(podkat)
Loading required package: Rsamtools
Loading required package: GenomeInfoDb
Loading required package: stats4
Loading required package: BiocGenerics
Loading required package: parallel

Attaching package: 'BiocGenerics'

The following objects are masked from 'package:parallel':

    clusterApply, clusterApplyLB, clusterCall, clusterEvalQ,
    clusterExport, clusterMap, parApply, parCapply, parLapply,
    parLapplyLB, parRapply, parSapply, parSapplyLB

The following objects are masked from 'package:stats':

    IQR, mad, xtabs

The following objects are masked from 'package:base':

    Filter, Find, Map, Position, Reduce, anyDuplicated, append,
    as.data.frame, cbind, colnames, do.call, duplicated, eval, evalq,
    get, grep, grepl, intersect, is.unsorted, lapply, lengths, mapply,
    match, mget, order, paste, pmax, pmax.int, pmin, pmin.int, rank,
    rbind, rownames, sapply, setdiff, sort, table, tapply, union,
    unique, unsplit

Loading required package: S4Vectors

Attaching package: 'S4Vectors'

The following objects are masked from 'package:base':

    colMeans, colSums, expand.grid, rowMeans, rowSums

Loading required package: IRanges
Loading required package: GenomicRanges
Loading required package: Biostrings
Loading required package: XVector
> png(filename="/home/ddbj/snapshot/RGM3/R_BC/result/podkat/podkat-package.Rd_%03d_medium.png", width=480, height=480)
> ### Name: podkat-package
> ### Title: PODKAT Package
> ### Aliases: podkat-package podkat
> ### Keywords: package
>
> ### ** Examples
>
> ## load genome description
> data(hgA)
>
> ## partition genome into overlapping windows
> windows <- partitionRegions(hgA)
>
> ## load genotype data from VCF file
> vcfFile <- system.file("examples/example1.vcf.gz", package="podkat")
> Z <- readGenotypeMatrix(vcfFile)
>
> ## read phenotype data from CSV file (continuous trait + covariates)
> phenoFile <- system.file("examples/example1lin.csv", package="podkat")
> pheno <-read.table(phenoFile, header=TRUE, sep=",")
>
> ## train null model with all covariates in data frame 'pheno'
> nm.lin <- nullModel(y ~ ., pheno)
>
> ## perform association test
> res <- assocTest(Z, nm.lin, windows)
>
> ## display results
> print(res)
Overview of association test:
	Null model: linear
	Number of samples: 200
	Number of regions: 79
	Number of regions without variants: 0
	Average number of variants in regions: 24.1
	Genome: hgA
	Kernel: linear.podkat
	p-value adjustment: none

Overview of significance of results:
	Number of tests with p < 0.05: 8

Results for the 8 most significant regions:
  seqnames  start    end width  n         Q      p.value
1     chr1   7501  12500  5000 31 769748.34 1.294084e-07
2     chr1  10001  15000  5000 33 764828.81 4.874460e-06
3     chr1 140001 145000  5000 15  79937.68 3.599077e-03
4     chr1   5001  10000  5000 34 152555.30 9.785569e-03
5     chr1 132501 137500  5000 21  89287.55 1.349559e-02
6     chr1 142501 147500  5000 23  94629.68 3.338620e-02
7     chr1  42501  47500  5000 19  58191.23 3.341032e-02
8     chr1  25001  30000  5000 23 103713.12 3.754557e-02
> print(p.adjust(res))
Overview of association test:
	Null model: linear
	Number of samples: 200
	Number of regions: 79
	Number of regions without variants: 0
	Average number of variants in regions: 24.1
	Genome: hgA
	Kernel: linear.podkat
	p-value adjustment: holm

Overview of significance of results:
	Number of tests with p < 0.05: 8
	Number of tests with adj. p < 0.05: 2

Results for the 8 most significant regions:
  seqnames  start    end width  n         Q      p.value  p.value.adj
1     chr1   7501  12500  5000 31 769748.34 1.294084e-07 1.022327e-05
2     chr1  10001  15000  5000 33 764828.81 4.874460e-06 3.802079e-04
3     chr1 140001 145000  5000 15  79937.68 3.599077e-03 2.771289e-01
4     chr1   5001  10000  5000 34 152555.30 9.785569e-03 7.437033e-01
5     chr1 132501 137500  5000 21  89287.55 1.349559e-02 1.000000e+00
6     chr1 142501 147500  5000 23  94629.68 3.338620e-02 1.000000e+00
7     chr1  42501  47500  5000 19  58191.23 3.341032e-02 1.000000e+00
8     chr1  25001  30000  5000 23 103713.12 3.754557e-02 1.000000e+00
> plot(p.adjust(res), which="p.value.adj")
>
>
>
>
>
> dev.off()
null device
          1
>
|