Supported by Dr. Osamu Ogasawara and  . . |
|
Last data update: 2014.03.03 |
Quantile-Quantile PlotsDescriptionFunctions for visualizing association test results by means of a quantile-quantile (Q-Q) plot Usage
## S4 method for signature 'AssocTestResultRanges,missing'
qqplot(x, y,
       xlab=deparse(substitute(x)), ylab=deparse(substitute(y)),
       common.scale=TRUE, preserveLabels=FALSE, lwd=1,
       lcol="red", ...)
## S4 method for signature 'AssocTestResultRanges,AssocTestResultRanges'
qqplot(x, y,
       xlab=deparse(substitute(x)), ylab=deparse(substitute(y)),
       common.scale=TRUE, preserveLabels=FALSE, lwd=1,
       lcol="red", ...)
Arguments
DetailsIf If Valuelike the standard Author(s)Ulrich Bodenhofer bodenhofer@bioinf.jku.at Referenceshttp://www.bioinf.jku.at/software/podkat See Also
Examples
## load genome description
data(hgA)
## partition genome into overlapping windows
windows <- partitionRegions(hgA)
## load genotype data from VCF file
vcfFile <- system.file("examples/example1.vcf.gz", package="podkat")
Z <- readGenotypeMatrix(vcfFile)
## read phenotype data from CSV file (continuous trait + covariates)
phenoFile <- system.file("examples/example1lin.csv", package="podkat")
pheno <-read.table(phenoFile, header=TRUE, sep=",")
## train null model with all covariates in data frame 'pheno'
nm.lin <- nullModel(y ~ ., pheno)
## perform association tests
res.p <- assocTest(Z, nm.lin, windows, kernel="linear.podkat")
res.s <- assocTest(Z, nm.lin, windows, kernel="linear.SKAT")
## plot results
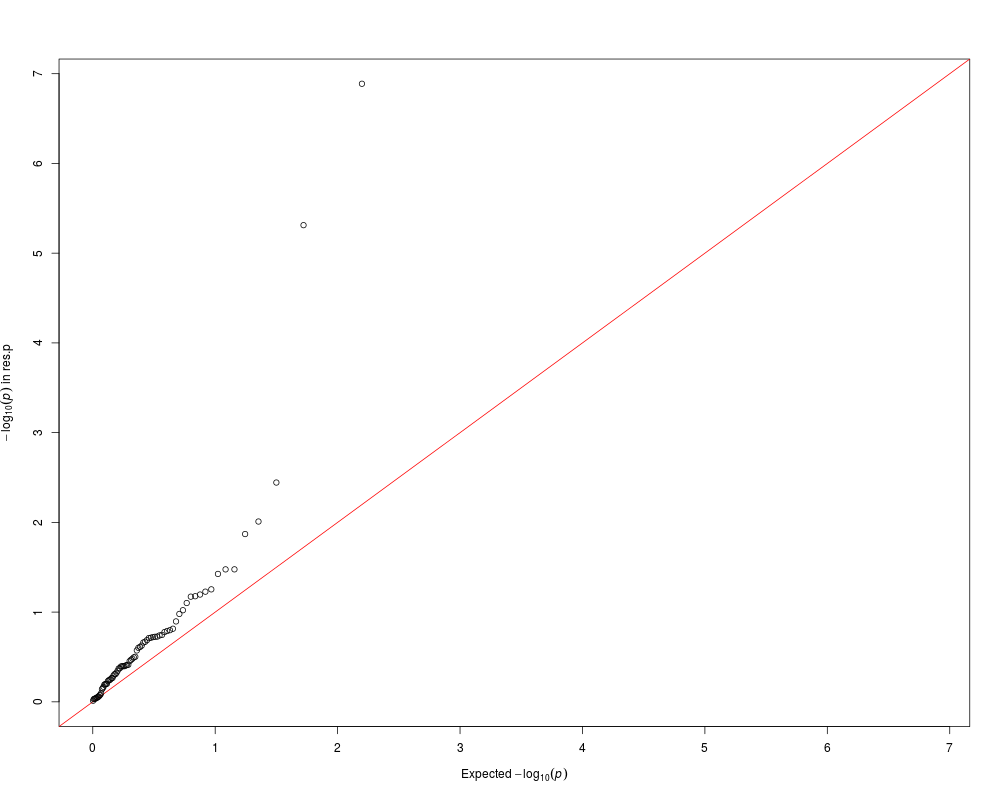
qqplot(res.p)
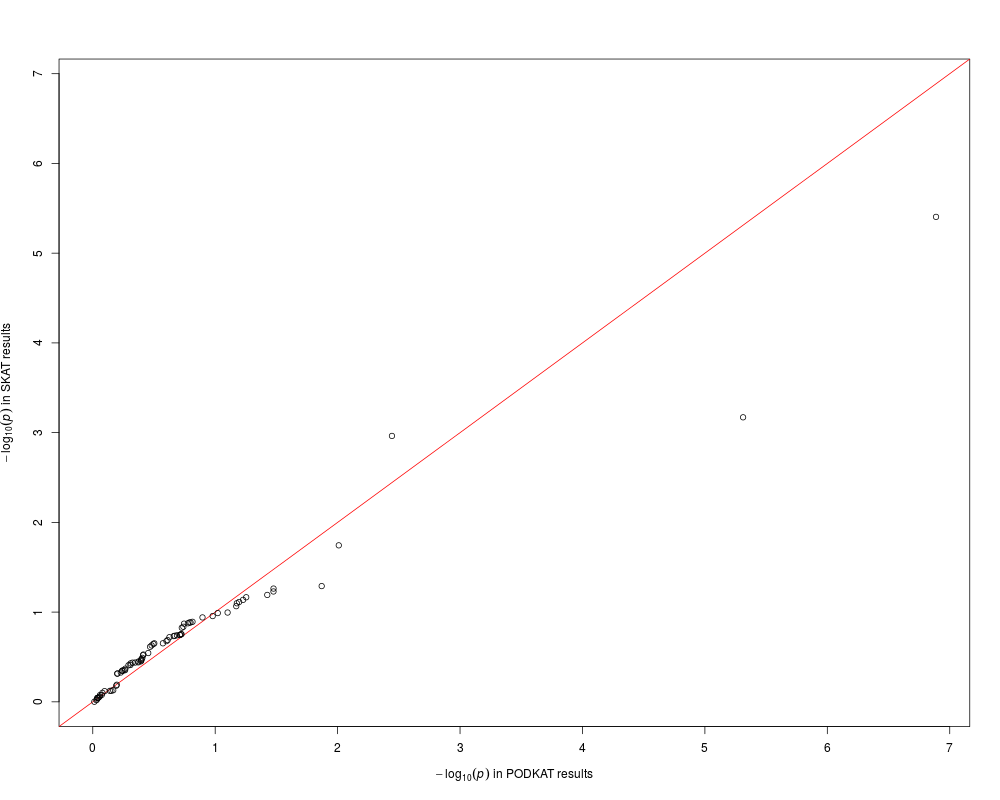
qqplot(res.p, res.s, xlab="PODKAT results", ylab="SKAT results")
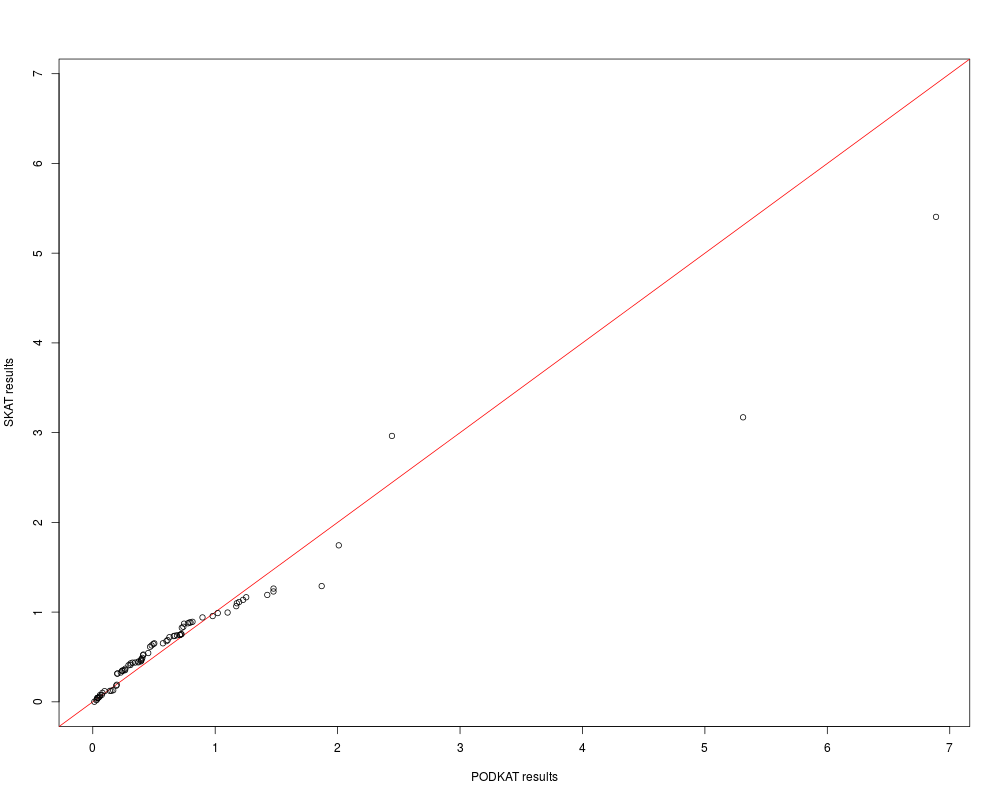
qqplot(res.p, res.s, xlab="PODKAT results", ylab="SKAT results",
preserveLabels=TRUE)
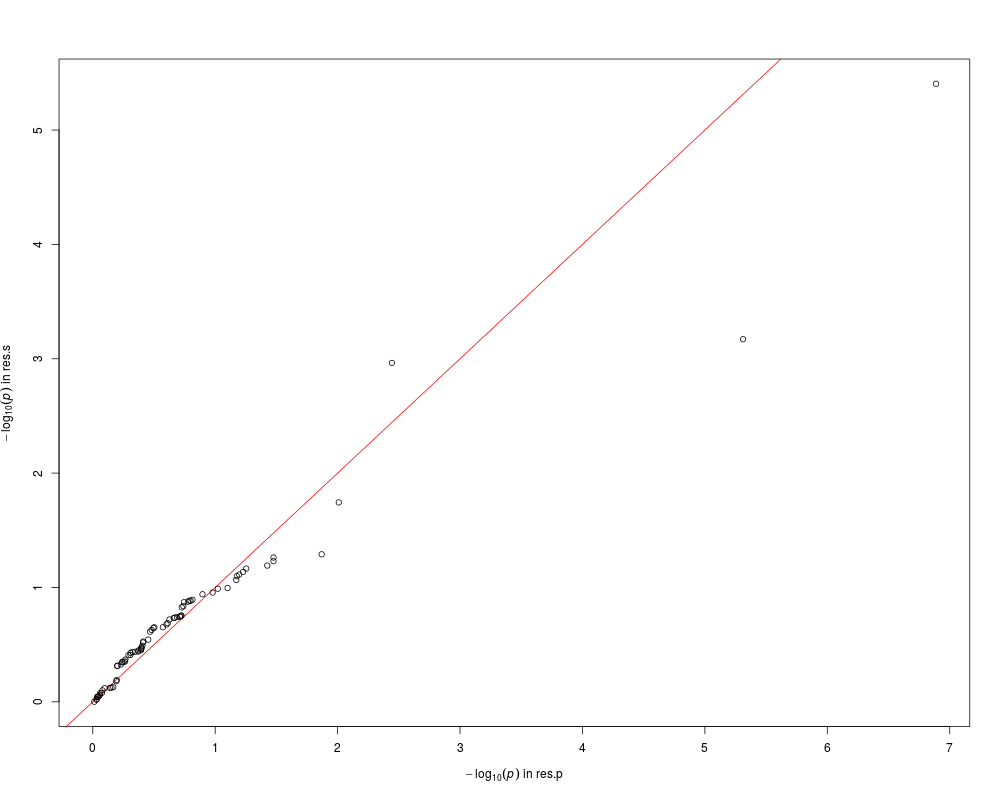
qqplot(res.p, res.s, common.scale=FALSE)
Results
R version 3.3.1 (2016-06-21) -- "Bug in Your Hair"
Copyright (C) 2016 The R Foundation for Statistical Computing
Platform: x86_64-pc-linux-gnu (64-bit)

R is free software and comes with ABSOLUTELY NO WARRANTY.
You are welcome to redistribute it under certain conditions.
Type 'license()' or 'licence()' for distribution details.

R is a collaborative project with many contributors.
Type 'contributors()' for more information and
'citation()' on how to cite R or R packages in publications.

Type 'demo()' for some demos, 'help()' for on-line help, or
'help.start()' for an HTML browser interface to help.
Type 'q()' to quit R.

> library(podkat)
Loading required package: Rsamtools
Loading required package: GenomeInfoDb
Loading required package: stats4
Loading required package: BiocGenerics
Loading required package: parallel

Attaching package: 'BiocGenerics'

The following objects are masked from 'package:parallel':

    clusterApply, clusterApplyLB, clusterCall, clusterEvalQ,
    clusterExport, clusterMap, parApply, parCapply, parLapply,
    parLapplyLB, parRapply, parSapply, parSapplyLB

The following objects are masked from 'package:stats':

    IQR, mad, xtabs

The following objects are masked from 'package:base':

    Filter, Find, Map, Position, Reduce, anyDuplicated, append,
    as.data.frame, cbind, colnames, do.call, duplicated, eval, evalq,
    get, grep, grepl, intersect, is.unsorted, lapply, lengths, mapply,
    match, mget, order, paste, pmax, pmax.int, pmin, pmin.int, rank,
    rbind, rownames, sapply, setdiff, sort, table, tapply, union,
    unique, unsplit

Loading required package: S4Vectors

Attaching package: 'S4Vectors'

The following objects are masked from 'package:base':

    colMeans, colSums, expand.grid, rowMeans, rowSums

Loading required package: IRanges
Loading required package: GenomicRanges
Loading required package: Biostrings
Loading required package: XVector
> png(filename="/home/ddbj/snapshot/RGM3/R_BC/result/podkat/qqplot-methods.Rd_%03d_medium.png", width=480, height=480)
> ### Name: qqplot
> ### Title: Quantile-Quantile Plots
> ### Aliases: qqplot qqplot-methods
> ###   qqplot,AssocTestResultRanges,missing-method
> ###   qqplot,AssocTestResultRanges,AssocTestResultRanges-method
> ### Keywords: methods
>
> ### ** Examples
>
> ## load genome description
> data(hgA)
>
> ## partition genome into overlapping windows
> windows <- partitionRegions(hgA)
>
> ## load genotype data from VCF file
> vcfFile <- system.file("examples/example1.vcf.gz", package="podkat")
> Z <- readGenotypeMatrix(vcfFile)
>
> ## read phenotype data from CSV file (continuous trait + covariates)
> phenoFile <- system.file("examples/example1lin.csv", package="podkat")
> pheno <-read.table(phenoFile, header=TRUE, sep=",")
>
> ## train null model with all covariates in data frame 'pheno'
> nm.lin <- nullModel(y ~ ., pheno)
>
> ## perform association tests
> res.p <- assocTest(Z, nm.lin, windows, kernel="linear.podkat")
> res.s <- assocTest(Z, nm.lin, windows, kernel="linear.SKAT")
>
> ## plot results
> qqplot(res.p)
> qqplot(res.p, res.s, xlab="PODKAT results", ylab="SKAT results")
> qqplot(res.p, res.s, xlab="PODKAT results", ylab="SKAT results",
+        preserveLabels=TRUE)
> qqplot(res.p, res.s, common.scale=FALSE)
>
>
>
>
>
> dev.off()
null device
          1
>
|