Supported by Dr. Osamu Ogasawara and  . . |
|
Last data update: 2014.03.03 |
Plot a well statistic for microtiter plates.DescriptionPlot a well statistic in false color representation or using a self-defined grid plotting function. The plot is supposed to resemble the physical geometry of a microtitre plate. Usage
plotPlate(x,nrow = 8, ncol = 12, col=c("red", "blue"),
ind = 1:(ncol*nrow), xrange=function(y) range(y, na.rm=TRUE), na.action = "zero",
main, char, desc = character(2), add=FALSE, gridFun="default",
funArgs=NULL,...)
Arguments
for examples.
Details You may use this function either to create plots showing a
single-value per well statistic for microtiter plates, or you can use a
self-made plotting function using a combination of any valid grid
commands to produce arbitrary plots in a plate array format. These plots
may also show multifactorial data. Self-defined plotting functions need
to have Argument To further increase the amount of information of the platePlot one may
decorate wells with short annotations using argument ValueThe function produces a plot in the active graphics device. It returns a list withfour elements. The element Author(s)Florian Hahne, Wolfgang Huber http://www.ebi.ac.uk/huber See Also
Examples
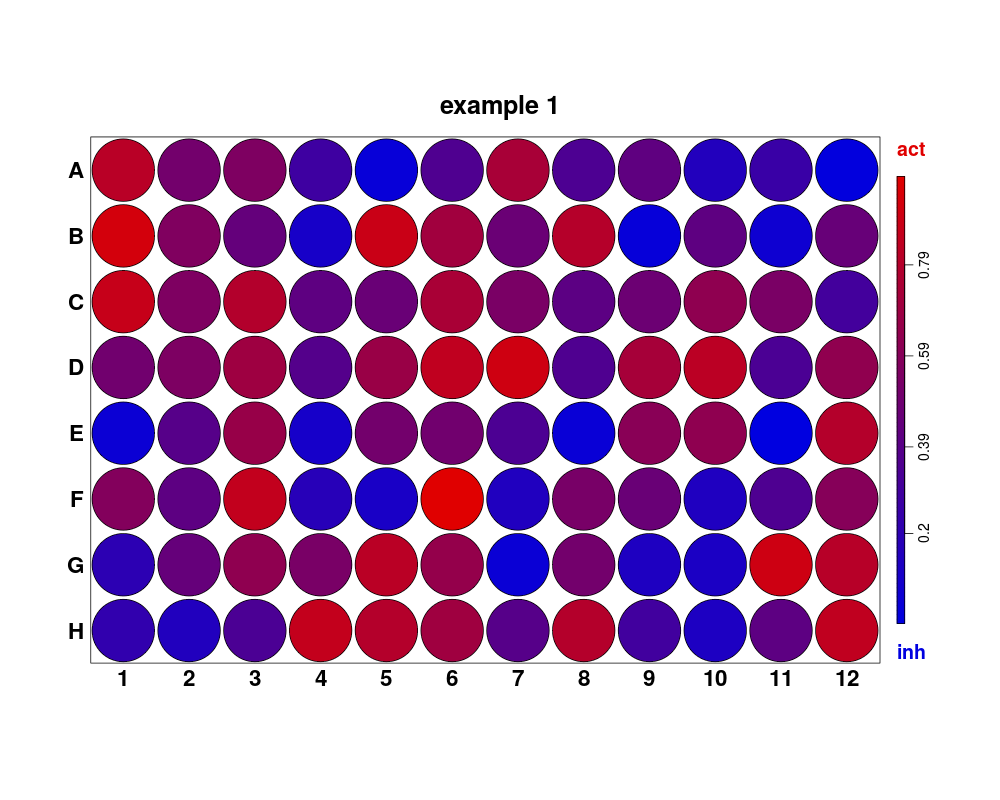
plotPlate(runif(96), main="example 1", col=c("#0000e0", "#e00000"), desc=c("act", "inh"))
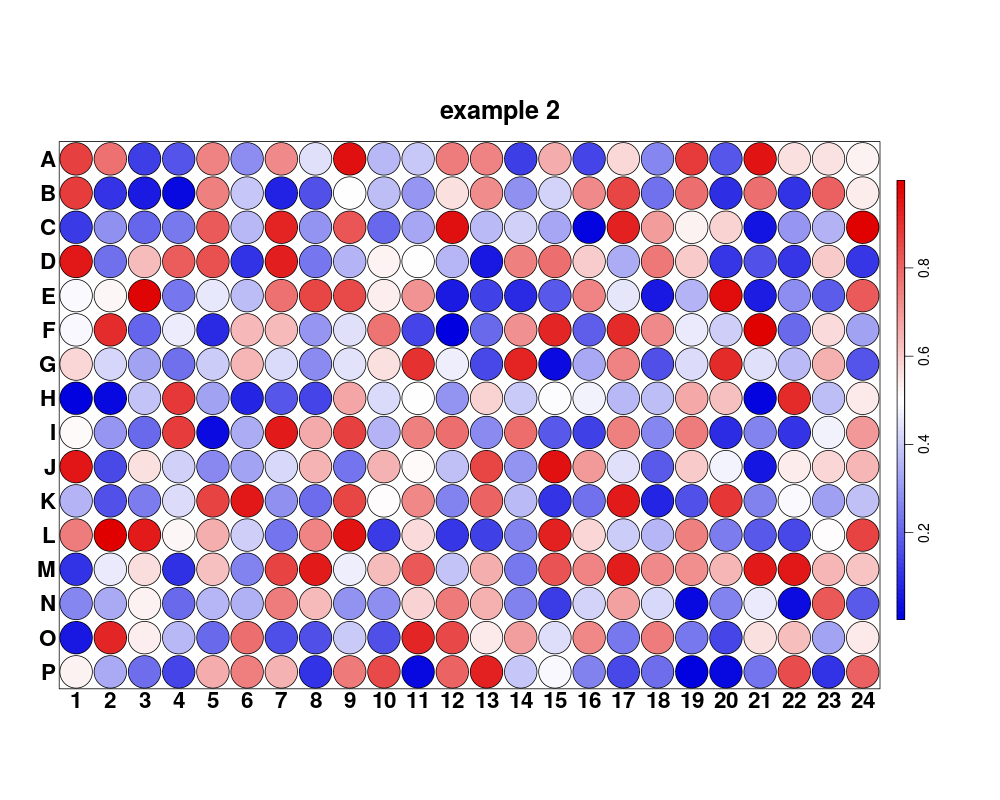
plotPlate(runif(384), nrow=16, ncol=24, main="example 2", col=c("#0000e0", "white", "#e00000"))
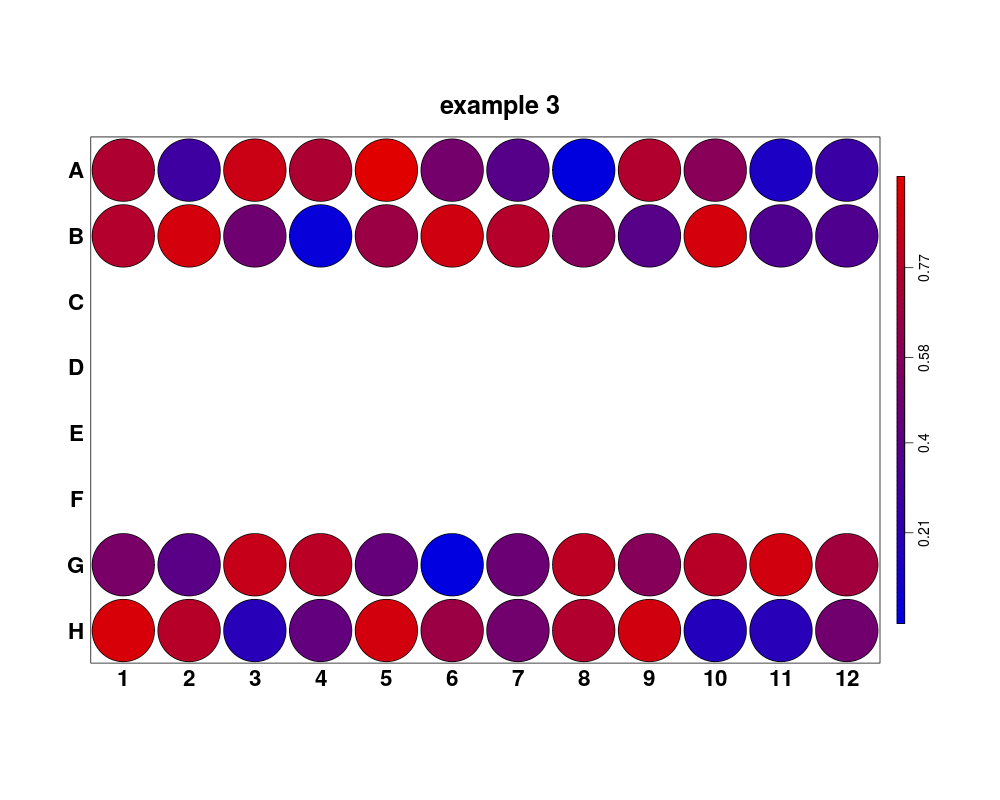
plotPlate(runif(48), main="example 3", col=c("#0000e0", "#e00000"), ind=c(1:24, 73:96))
x <- runif(96)
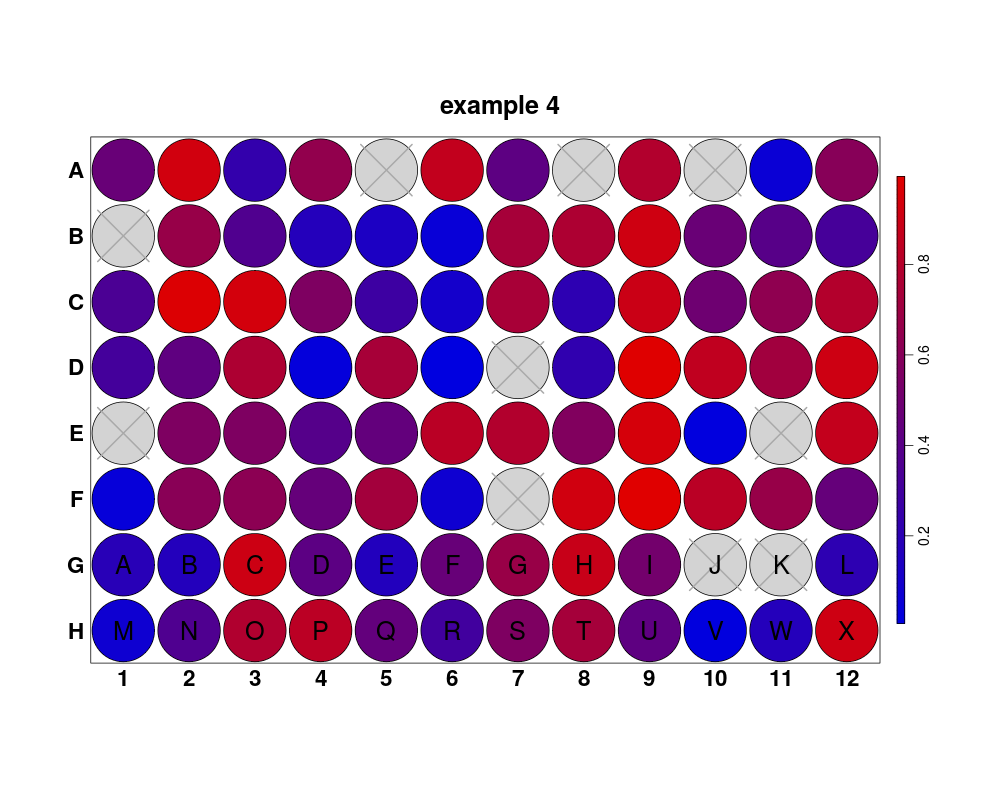
x[sample(96, 10)] <- NA
plotPlate(x, main="example 4", col=c("#0000e0", "#e00000"),
char=c(rep(NA, 72), LETTERS[1:24]), na.action="xout")
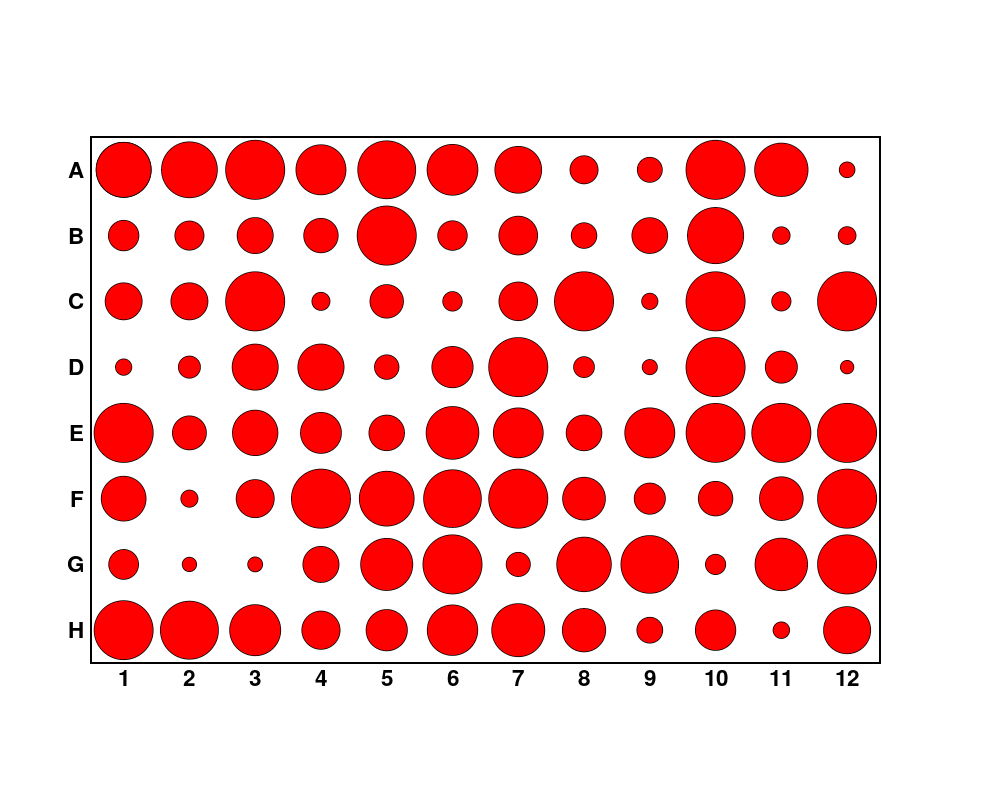
plotPlate(runif(96, min=0.1, max=0.5), gridFun=".drawCircle")
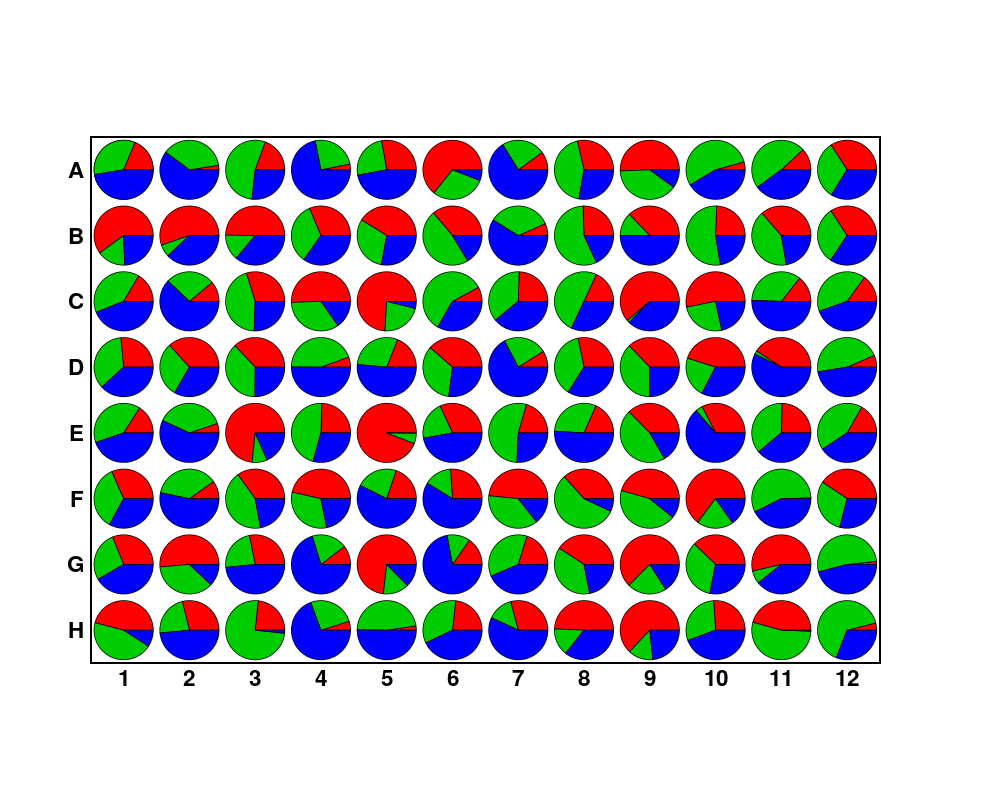
plotPlate(matrix(runif(288), ncol=3), gridFun=".drawPie",
funArgs=as.data.frame(matrix(2:4, ncol=3, nrow=96, byrow=TRUE)))
Results
R version 3.3.1 (2016-06-21) -- "Bug in Your Hair"
Copyright (C) 2016 The R Foundation for Statistical Computing
Platform: x86_64-pc-linux-gnu (64-bit)

R is free software and comes with ABSOLUTELY NO WARRANTY.
You are welcome to redistribute it under certain conditions.
Type 'license()' or 'licence()' for distribution details.

R is a collaborative project with many contributors.
Type 'contributors()' for more information and
'citation()' on how to cite R or R packages in publications.

Type 'demo()' for some demos, 'help()' for on-line help, or
'help.start()' for an HTML browser interface to help.
Type 'q()' to quit R.

> library(prada)
Loading required package: Biobase
Loading required package: BiocGenerics
Loading required package: parallel

Attaching package: 'BiocGenerics'

The following objects are masked from 'package:parallel':

    clusterApply, clusterApplyLB, clusterCall, clusterEvalQ,
    clusterExport, clusterMap, parApply, parCapply, parLapply,
    parLapplyLB, parRapply, parSapply, parSapplyLB

The following objects are masked from 'package:stats':

    IQR, mad, xtabs

The following objects are masked from 'package:base':

    Filter, Find, Map, Position, Reduce, anyDuplicated, append,
    as.data.frame, cbind, colnames, do.call, duplicated, eval, evalq,
    get, grep, grepl, intersect, is.unsorted, lapply, lengths, mapply,
    match, mget, order, paste, pmax, pmax.int, pmin, pmin.int, rank,
    rbind, rownames, sapply, setdiff, sort, table, tapply, union,
    unique, unsplit

Welcome to Bioconductor

    Vignettes contain introductory material; view with
    'browseVignettes()'. To cite Bioconductor, see
    'citation("Biobase")', and for packages 'citation("pkgname")'.

Loading required package: RColorBrewer
Loading required package: grid
Loading required package: rrcov
Loading required package: robustbase

Attaching package: 'robustbase'

The following object is masked from 'package:Biobase':

    rowMedians

Scalable Robust Estimators with High Breakdown Point (version 1.3-11)

> png(filename="/home/ddbj/snapshot/RGM3/R_BC/result/prada/plotPlate.Rd_%03d_medium.png", width=480, height=480)
> ### Name: plotPlate
> ### Title: Plot a well statistic for microtiter plates.
> ### Aliases: plotPlate
> ### Keywords: hplot
>
> ### ** Examples
>
> plotPlate(runif(96), main="example 1", col=c("#0000e0", "#e00000"), desc=c("act", "inh"))
> plotPlate(runif(384), nrow=16, ncol=24, main="example 2", col=c("#0000e0", "white", "#e00000"))
> plotPlate(runif(48), main="example 3", col=c("#0000e0", "#e00000"), ind=c(1:24, 73:96))
> x <- runif(96)
> x[sample(96, 10)] <- NA
> plotPlate(x, main="example 4", col=c("#0000e0", "#e00000"),
+ char=c(rep(NA, 72), LETTERS[1:24]), na.action="xout")
> plotPlate(runif(96, min=0.1, max=0.5), gridFun=".drawCircle")
> plotPlate(matrix(runif(288), ncol=3), gridFun=".drawPie",
+ funArgs=as.data.frame(matrix(2:4, ncol=3, nrow=96, byrow=TRUE)))
>
>
>
>
>
>
> dev.off()
null device
          1
>
|