R version 3.3.1 (2016-06-21) -- "Bug in Your Hair"
Copyright (C) 2016 The R Foundation for Statistical Computing
Platform: x86_64-pc-linux-gnu (64-bit)
R is free software and comes with ABSOLUTELY NO WARRANTY.
You are welcome to redistribute it under certain conditions.
Type 'license()' or 'licence()' for distribution details.
R is a collaborative project with many contributors.
Type 'contributors()' for more information and
'citation()' on how to cite R or R packages in publications.
Type 'demo()' for some demos, 'help()' for on-line help, or
'help.start()' for an HTML browser interface to help.
Type 'q()' to quit R.
> library(seqTools)
Loading required package: zlibbioc
> png(filename="/home/ddbj/snapshot/RGM3/R_BC/result/seqTools/plotPhredQuant.Rd_%03d_medium.png", width=480, height=480)
> ### Name: plotPhredQuant
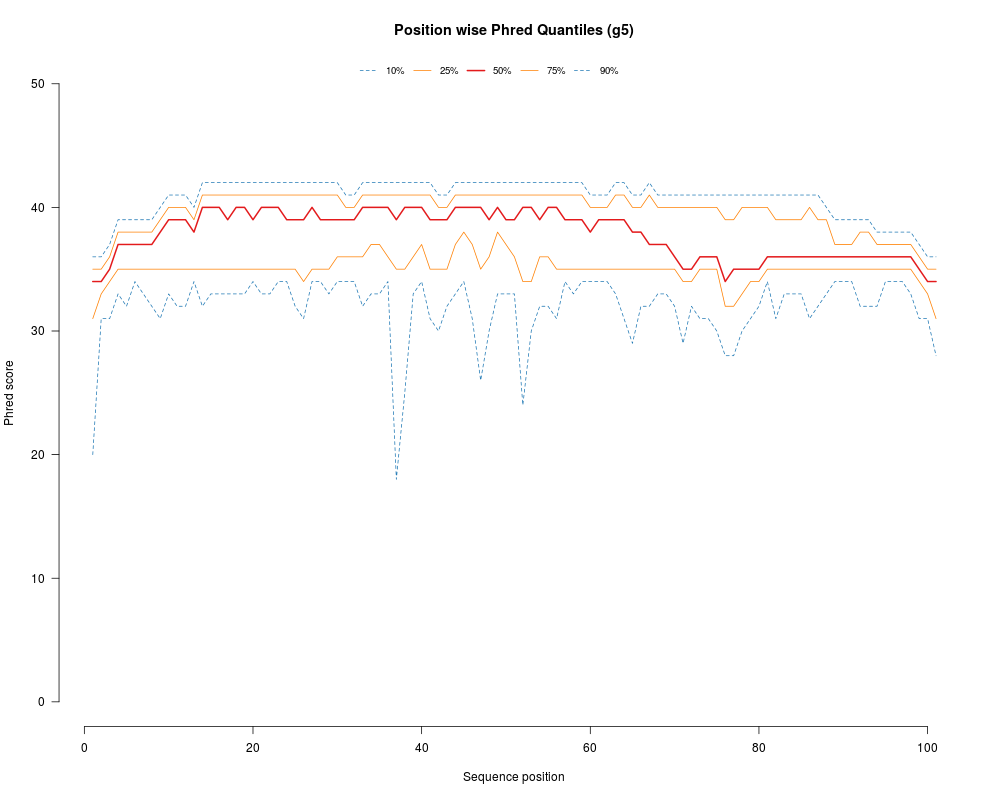
> ### Title: plotPhredQuant: Plots the position wise 10%, 25 %, 50%, 75% and
> ### 90 % quantiles of phred values.
> ### Aliases: plotPhredQuant plotPhredQuant-methods
> ### plotPhredQuant,Fastqq-method
> ### Keywords: plotPhredQuant kmer
>
> ### ** Examples
>
> basedir <- system.file("extdata",package="seqTools")
> #
> setwd(basedir)
> fq <- fastqq(c("g4_l101_n100.fq.gz", "g5_l101_n100.fq.gz"), k=4,
+ probeLabel=c("g4", "g5"))
[fastqq] File ( 1/2) 'g4_l101_n100.fq.gz' done.
[fastqq] File ( 2/2) 'g5_l101_n100.fq.gz' done.
> #
> plotPhredQuant(fq, 2)
> # Same plot without x-axis
> plotPhredQuant(fq,2, xaxt="n")
>
>
>
>
>
> dev.off()
null device
1
>
 .
.