Supported by Dr. Osamu Ogasawara and  . . |
|
Last data update: 2014.03.03 |
Create an Interpolation SplineDescriptionCreate an interpolation spline, either from Usage
interpSpline(obj1, obj2, bSpline = FALSE, period = NULL,
             na.action = na.fail, sparse = FALSE)
Arguments
ValueAn object that inherits from (S3) class Author(s)Douglas Bates and Bill Venables See Also
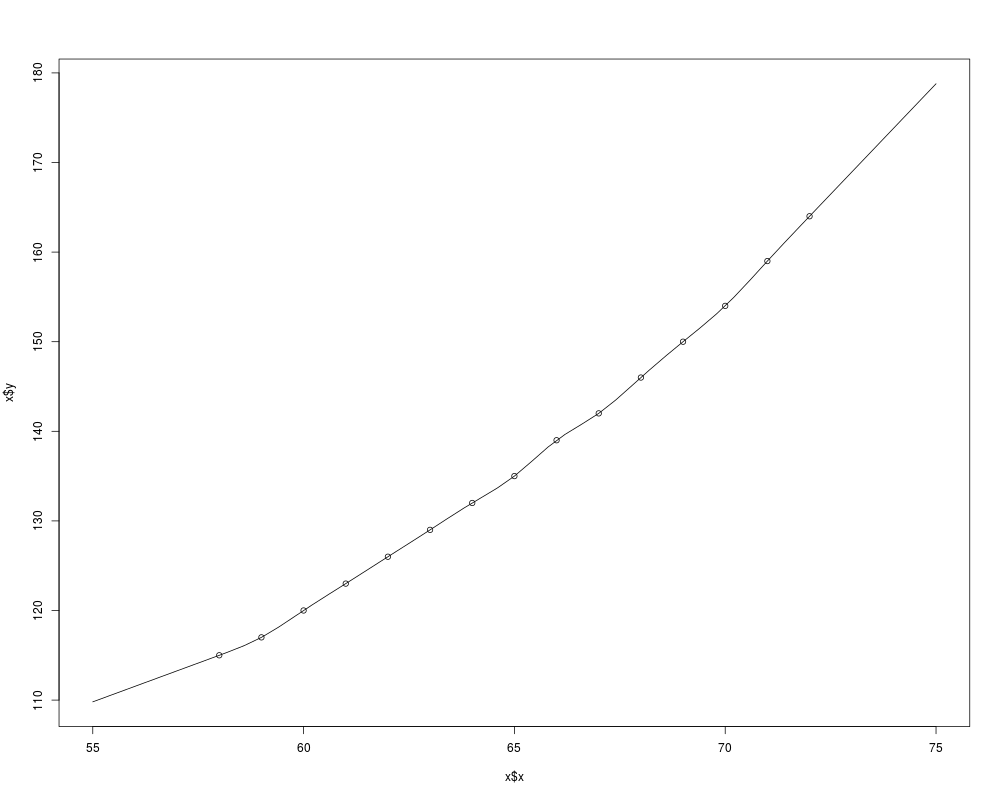
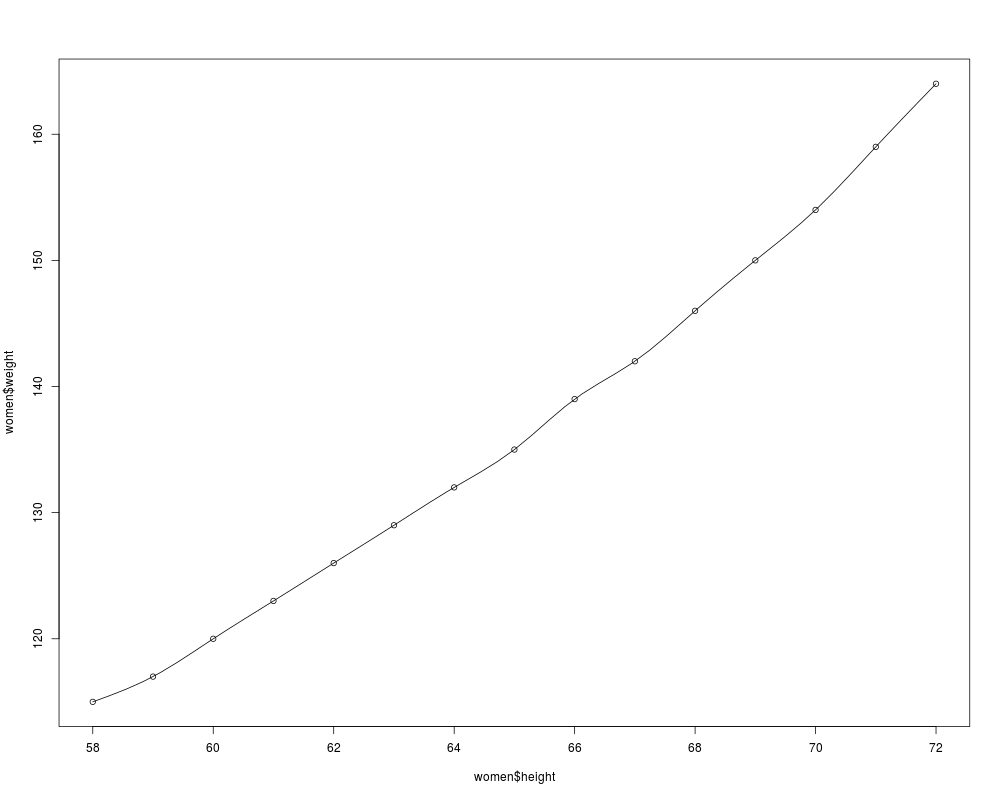
Examplesrequire(graphics); require(stats) ispl <- interpSpline( women$height, women$weight ) ispl2 <- interpSpline( weight ~ height, women ) # ispl and ispl2 should be the same plot( predict( ispl, seq( 55, 75, length.out = 51 ) ), type = "l" ) points( women$height, women$weight ) plot( ispl ) # plots over the range of the knots points( women$height, women$weight ) splineKnots( ispl ) Results
R version 3.3.1 (2016-06-21) -- "Bug in Your Hair"
Copyright (C) 2016 The R Foundation for Statistical Computing
Platform: x86_64-pc-linux-gnu (64-bit)

R is free software and comes with ABSOLUTELY NO WARRANTY.
You are welcome to redistribute it under certain conditions.
Type 'license()' or 'licence()' for distribution details.

R is a collaborative project with many contributors.
Type 'contributors()' for more information and
'citation()' on how to cite R or R packages in publications.

Type 'demo()' for some demos, 'help()' for on-line help, or
'help.start()' for an HTML browser interface to help.
Type 'q()' to quit R.

> library(splines)
> png(filename="/home/ddbj/snapshot/RGM3/R_rel/result/splines/interpSpline.Rd_%03d_medium.png", width=480, height=480)
> ### Name: interpSpline
> ### Title: Create an Interpolation Spline
> ### Aliases: interpSpline
> ### Keywords: models
>
> ### ** Examples
>
> require(graphics); require(stats)
> ispl <- interpSpline( women$height, women$weight )
> ispl2 <- interpSpline( weight ~ height,  women )
> # ispl and ispl2 should be the same
> plot( predict( ispl, seq( 55, 75, length.out = 51 ) ), type = "l" )
> points( women$height, women$weight )
> plot( ispl )    # plots over the range of the knots
> points( women$height, women$weight )
> splineKnots( ispl )
 [1] 58 59 60 61 62 63 64 65 66 67 68 69 70 71 72
>
>
>
>
>
> dev.off()
null device
          1
>
|