Supported by Dr. Osamu Ogasawara and  . . |
|
Last data update: 2014.03.03 |
Create a Periodic Interpolation SplineDescriptionCreate a periodic interpolation spline, either from UsageperiodicSpline(obj1, obj2, knots, period = 2*pi, ord = 4) Arguments
ValueAn object that inherits from class Author(s)Douglas Bates and Bill Venables See Also
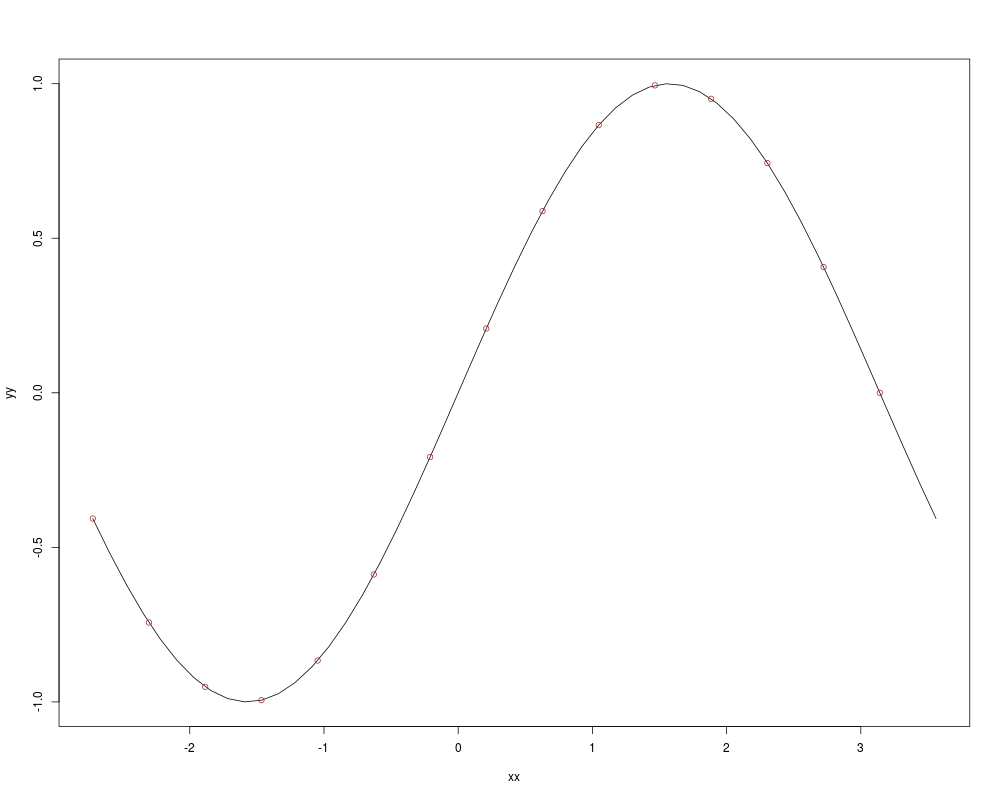
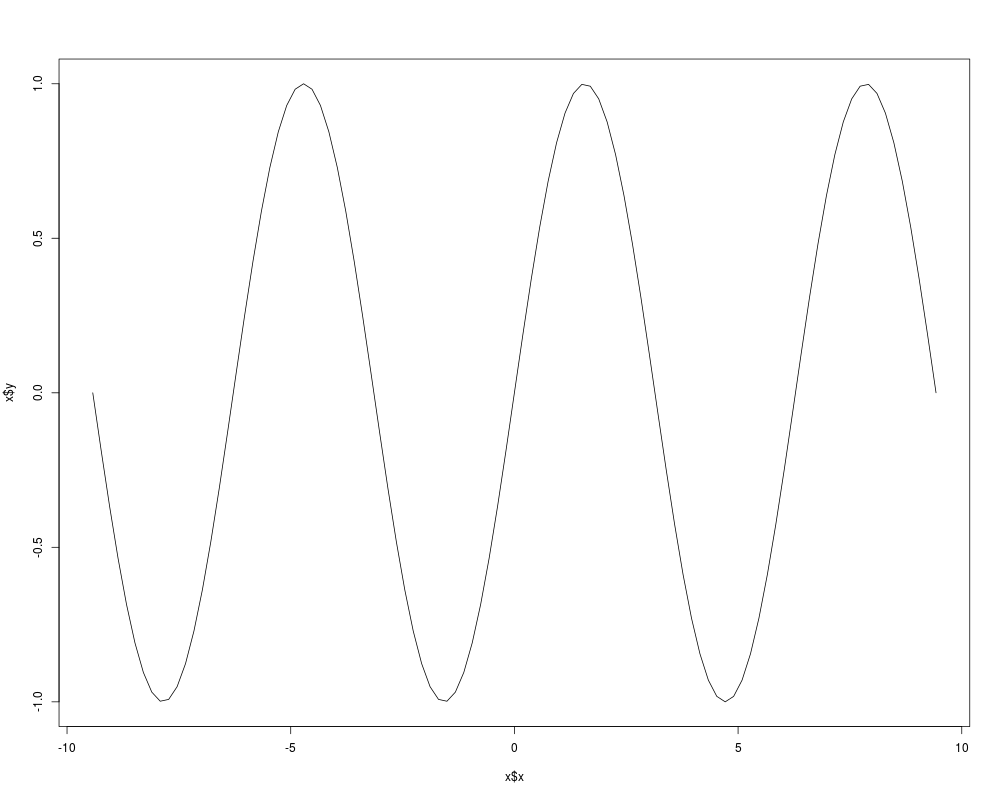
Examplesrequire(graphics); require(stats) xx <- seq( -pi, pi, length.out = 16 )[-1] yy <- sin( xx ) frm <- data.frame( xx, yy ) pispl <- periodicSpline( xx, yy, period = 2 * pi) pispl pispl2 <- periodicSpline( yy ~ xx, frm, period = 2 * pi ) stopifnot(all.equal(pispl, pispl2)) # pispl and pispl2 are the same plot( pispl ) # displays over one period points( yy ~ xx, col = "brown") plot( predict( pispl, seq(-3*pi, 3*pi, length.out = 101) ), type = "l" ) Results
R version 3.3.1 (2016-06-21) -- "Bug in Your Hair"
Copyright (C) 2016 The R Foundation for Statistical Computing
Platform: x86_64-pc-linux-gnu (64-bit)

R is free software and comes with ABSOLUTELY NO WARRANTY.
You are welcome to redistribute it under certain conditions.
Type 'license()' or 'licence()' for distribution details.

R is a collaborative project with many contributors.
Type 'contributors()' for more information and
'citation()' on how to cite R or R packages in publications.

Type 'demo()' for some demos, 'help()' for on-line help, or
'help.start()' for an HTML browser interface to help.
Type 'q()' to quit R.

> library(splines)
> png(filename="/home/ddbj/snapshot/RGM3/R_rel/result/splines/periodicSpline.Rd_%03d_medium.png", width=480, height=480)
> ### Name: periodicSpline
> ### Title: Create a Periodic Interpolation Spline
> ### Aliases: periodicSpline
> ### Keywords: models
>
> ### ** Examples
>
> require(graphics); require(stats)
> xx <- seq( -pi, pi, length.out = 16 )[-1]
> yy <- sin( xx )
> frm <- data.frame( xx, yy )
> pispl <- periodicSpline( xx, yy, period = 2 * pi)
> ## No test:
> pispl
bSpline representation of spline for yy ~ xx
     -3.97935      -3.56047      -3.14159      -2.72271      -2.30383
           NA            NA            NA            NA  2.747662e-16
     -1.88496      -1.46608      -1.04720      -0.62832      -0.20944
-4.188059e-01 -7.651964e-01 -9.792775e-01 -1.024033e+00 -8.917232e-01
      0.20944       0.62832       1.04720       1.46608       1.88496
-6.052268e-01 -2.140811e-01  2.140811e-01  6.052268e-01  8.917232e-01
      2.30383       2.72271       3.14159       3.56047       3.97935
 1.024033e+00  9.792775e-01  7.651964e-01  4.188059e-01  2.747662e-16
      4.39823       4.81711
-4.188059e-01 -7.651964e-01
> ## End(No test)
> pispl2 <- periodicSpline( yy ~ xx, frm, period = 2 * pi )
> stopifnot(all.equal(pispl, pispl2))  # pispl and pispl2 are the same
>
> plot( pispl )          # displays over one period
> points( yy ~ xx, col = "brown")
> plot( predict( pispl, seq(-3*pi, 3*pi, length.out = 101) ), type = "l" )
>
>
>
>
>
> dev.off()
null device
          1
>
|