Supported by Dr. Osamu Ogasawara and  . . |
|
Last data update: 2014.03.03 |
Piecewise Polynomial Spline RepresentationDescriptionCreate the piecewise polynomial representation of a spline object. UsagepolySpline(object, ...) as.polySpline(object, ...) Arguments
ValueAn object that inherits from class Author(s)Douglas Bates and Bill Venables See Also
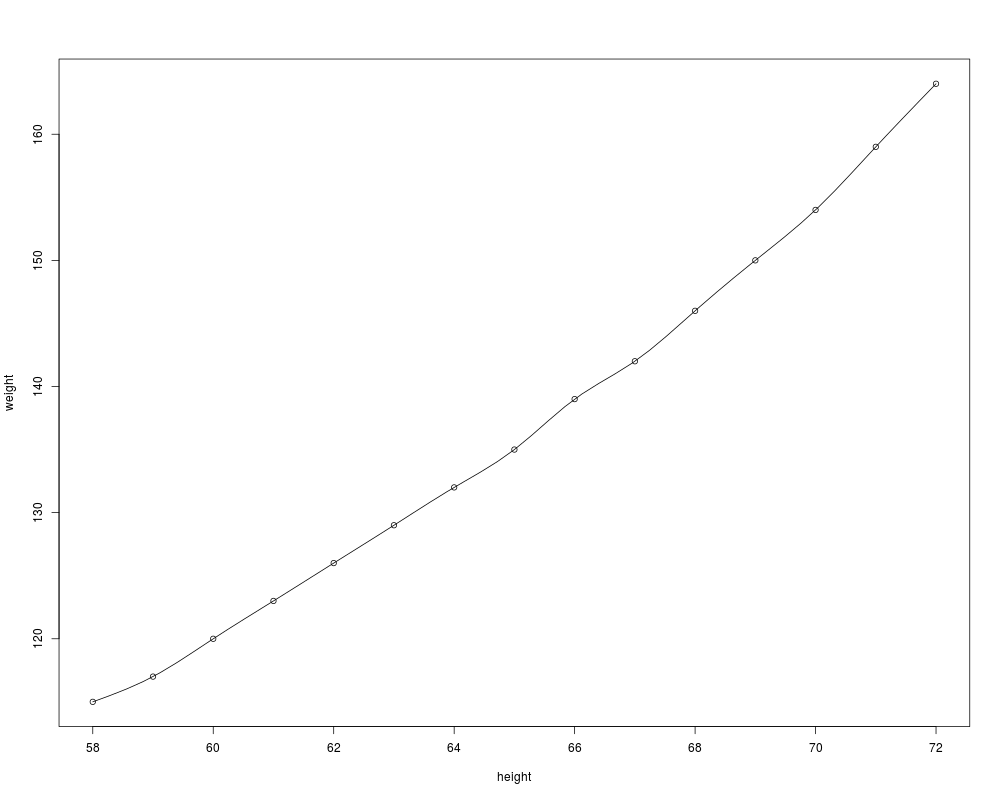
Examplesrequire(graphics) ispl <- polySpline(interpSpline( weight ~ height, women, bSpline = TRUE)) print( ispl ) # print the piecewise polynomial representation plot( ispl ) # plots over the range of the knots points( women$height, women$weight ) Results
R version 3.3.1 (2016-06-21) -- "Bug in Your Hair"
Copyright (C) 2016 The R Foundation for Statistical Computing
Platform: x86_64-pc-linux-gnu (64-bit)

R is free software and comes with ABSOLUTELY NO WARRANTY.
You are welcome to redistribute it under certain conditions.
Type 'license()' or 'licence()' for distribution details.

R is a collaborative project with many contributors.
Type 'contributors()' for more information and
'citation()' on how to cite R or R packages in publications.

Type 'demo()' for some demos, 'help()' for on-line help, or
'help.start()' for an HTML browser interface to help.
Type 'q()' to quit R.

> library(splines)
> png(filename="/home/ddbj/snapshot/RGM3/R_rel/result/splines/polySpline.Rd_%03d_medium.png", width=480, height=480)
> ### Name: polySpline
> ### Title: Piecewise Polynomial Spline Representation
> ### Aliases: polySpline as.polySpline
> ### Keywords: models
>
> ### ** Examples
>
> require(graphics)
> ispl <- polySpline(interpSpline( weight ~ height,  women, bSpline = TRUE))
> print( ispl )   # print the piecewise polynomial representation
polynomial representation of spline for weight ~ height
   constant   linear   quadratic       cubic
58      115 1.731918  0.00000000  0.26808191
59      117 2.536164  0.80424574 -0.34040957
60      120 3.123427 -0.21698298  0.09355638
61      123 2.970130  0.06368616 -0.03381595
62      126 2.996054 -0.03776168  0.04170740
63      129 3.045653  0.08736054 -0.13301367
64      132 2.821333 -0.31168048  0.49034728
65      135 3.669014  1.15936136 -0.82837545
66      139 3.502610 -1.32576498  0.82315452
67      142 3.320544  1.14369857 -0.46424262
68      146 4.215213 -0.24902928  0.03381595
69      150 3.818603 -0.14758144  0.32897883
70      154 4.510376  0.83935505 -0.34973127
71      159 5.139893 -0.20983876  0.06994625
72      164 4.930054  0.00000000  0.00000000
> plot( ispl )    # plots over the range of the knots
> points( women$height, women$weight )
>
>
>
>
>
> dev.off()
null device
          1
>
|
Created & Maintained by Osamu Ogasawara (osamu.ogasawara@gmail.com) and 