The predict methods for the classes that inherit from the
virtual classes bSpline and polySpline are used to
evaluate the spline or its derivatives. The plot method for a
spline object first evaluates predict with the x
argument missing, then plots the resulting xyVector with
type = "l".
Usage
## S3 method for class 'bSpline'
predict(object, x, nseg = 50, deriv = 0, ...)
## S3 method for class 'nbSpline'
predict(object, x, nseg = 50, deriv = 0, ...)
## S3 method for class 'pbSpline'
predict(object, x, nseg = 50, deriv = 0, ...)
## S3 method for class 'npolySpline'
predict(object, x, nseg = 50, deriv = 0, ...)
## S3 method for class 'ppolySpline'
predict(object, x, nseg = 50, deriv = 0, ...)
Arguments
object
An object that inherits from the bSpline or the
polySpline class.
x
A numeric vector of x values at which to evaluate the
spline. If this argument is missing a suitable set of x
values is generated as a sequence of nseq segments spanning
the range of the knots.
nseg
A positive integer giving the number of segments in a set
of equally-spaced x values spanning the range of the knots
in object. This value is only used if x is missing.
deriv
An integer between 0 and splineOrder(object) - 1
specifying the derivative to evaluate.
...
further arguments passed to or from other methods.
Value
an xyVector with components
x
the supplied or inferred numeric vector of x values
y
the value of the spline (or its deriv'th derivative)
at the x vector
Author(s)
Douglas Bates and Bill Venables
See Also
xyVector,
interpSpline,
periodicSpline
Examples
require(graphics); require(stats)
ispl <- interpSpline( weight ~ height, women )
opar <- par(mfrow = c(2, 2), las = 1)
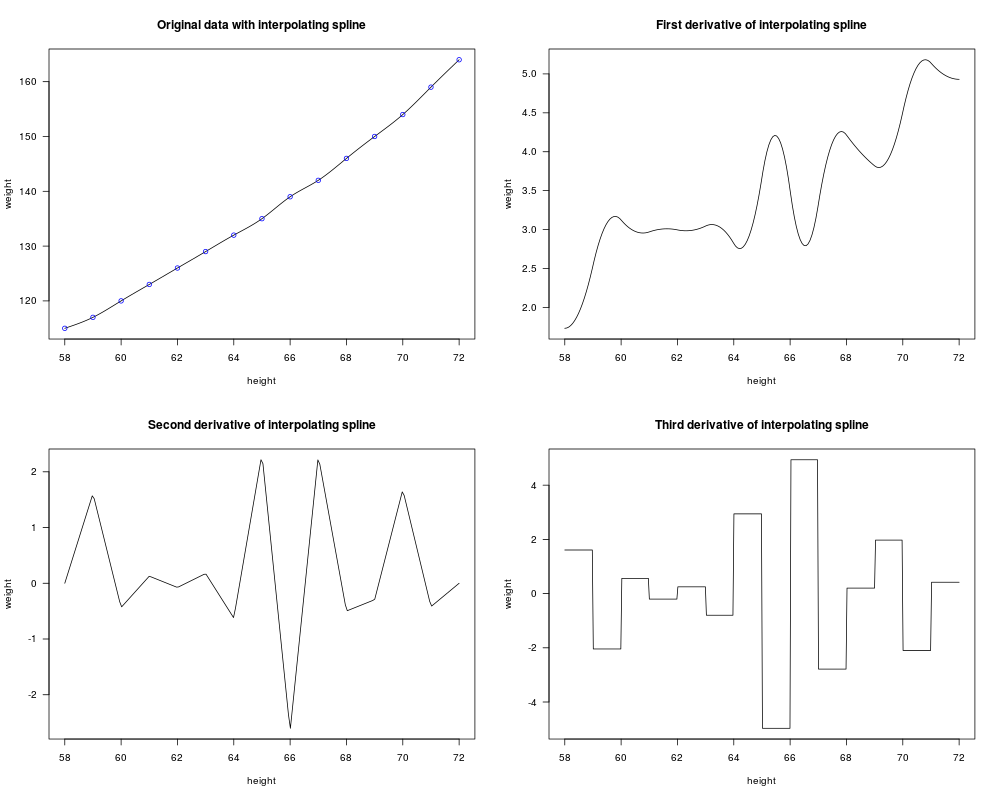
plot(predict(ispl, nseg = 201), # plots over the range of the knots
main = "Original data with interpolating spline", type = "l",
xlab = "height", ylab = "weight")
points(women$height, women$weight, col = 4)
plot(predict(ispl, nseg = 201, deriv = 1),
main = "First derivative of interpolating spline", type = "l",
xlab = "height", ylab = "weight")
plot(predict(ispl, nseg = 201, deriv = 2),
main = "Second derivative of interpolating spline", type = "l",
xlab = "height", ylab = "weight")
plot(predict(ispl, nseg = 401, deriv = 3),
main = "Third derivative of interpolating spline", type = "l",
xlab = "height", ylab = "weight")
par(opar)
Results
R version 3.3.1 (2016-06-21) -- "Bug in Your Hair"
Copyright (C) 2016 The R Foundation for Statistical Computing
Platform: x86_64-pc-linux-gnu (64-bit)

R is free software and comes with ABSOLUTELY NO WARRANTY.
You are welcome to redistribute it under certain conditions.
Type 'license()' or 'licence()' for distribution details.

R is a collaborative project with many contributors.
Type 'contributors()' for more information and
'citation()' on how to cite R or R packages in publications.

Type 'demo()' for some demos, 'help()' for on-line help, or
'help.start()' for an HTML browser interface to help.
Type 'q()' to quit R.

> library(splines)
> png(filename="/home/ddbj/snapshot/RGM3/R_rel/result/splines/predict.bSpline.Rd_%03d_medium.png", width=480, height=480)
> ### Name: predict.bSpline
> ### Title: Evaluate a Spline at New Values of x
> ### Aliases: predict.bSpline predict.nbSpline predict.pbSpline
> ###   predict.npolySpline predict.ppolySpline
> ### Keywords: models
>
> ### ** Examples
>
> require(graphics); require(stats)
> ispl <- interpSpline( weight ~ height,  women )
> opar <- par(mfrow = c(2, 2), las = 1)
> plot(predict(ispl, nseg = 201),     # plots over the range of the knots
+      main = "Original data with interpolating spline", type = "l",
+      xlab = "height", ylab = "weight")
> points(women$height, women$weight, col = 4)
> plot(predict(ispl, nseg = 201, deriv = 1),
+      main = "First derivative of interpolating spline", type = "l",
+      xlab = "height", ylab = "weight")
> plot(predict(ispl, nseg = 201, deriv = 2),
+      main = "Second derivative of interpolating spline", type = "l",
+      xlab = "height", ylab = "weight")
> plot(predict(ispl, nseg = 401, deriv = 3),
+      main = "Third derivative of interpolating spline", type = "l",
+      xlab = "height", ylab = "weight")
> par(opar)
>
>
>
>
>
> dev.off()
null device
          1
>
 .
.