Supported by Dr. Osamu Ogasawara and  . . |
|
Last data update: 2014.03.03 |
Construct an
|
x |
a numeric vector |
y |
a numeric vector of the same length as |
Value
An object of class xyVector with components
x |
a numeric vector |
y |
a numeric vector of the same length as |
Author(s)
Douglas Bates and Bill Venables
Examples
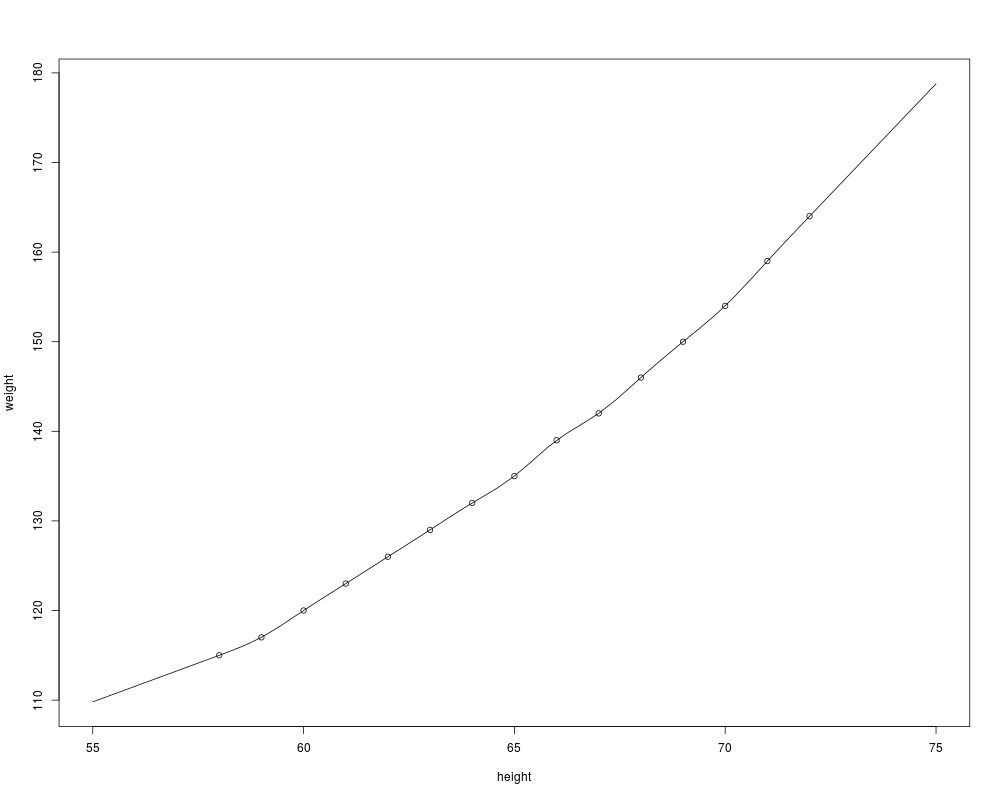
require(stats); require(graphics)
ispl <- interpSpline( weight ~ height, women )
weights <- predict( ispl, seq( 55, 75, length.out = 51 ))
class( weights )
plot( weights, type = "l", xlab = "height", ylab = "weight" )
points( women$height, women$weight )
weights
Results
R version 3.3.1 (2016-06-21) -- "Bug in Your Hair"
Copyright (C) 2016 The R Foundation for Statistical Computing
Platform: x86_64-pc-linux-gnu (64-bit)

R is free software and comes with ABSOLUTELY NO WARRANTY.
You are welcome to redistribute it under certain conditions.
Type 'license()' or 'licence()' for distribution details.

R is a collaborative project with many contributors.
Type 'contributors()' for more information and
'citation()' on how to cite R or R packages in publications.

Type 'demo()' for some demos, 'help()' for on-line help, or
'help.start()' for an HTML browser interface to help.
Type 'q()' to quit R.

> library(splines)
> png(filename="/home/ddbj/snapshot/RGM3/R_rel/result/splines/xyVector.Rd_%03d_medium.png", width=480, height=480)
> ### Name: xyVector
> ### Title: Construct an 'xyVector' Object
> ### Aliases: xyVector
> ### Keywords: models
>
> ### ** Examples
>
> require(stats); require(graphics)
> ispl <- interpSpline( weight ~ height, women )
> weights <- predict( ispl, seq( 55, 75, length.out = 51 ))
> class( weights )
[1] "xyVector"
> plot( weights, type = "l", xlab = "height", ylab = "weight" )
> points( women$height, women$weight )
> weights
$x
 [1] 55.0 55.4 55.8 56.2 56.6 57.0 57.4 57.8 58.2 58.6 59.0 59.4 59.8 60.2 60.6
[16] 61.0 61.4 61.8 62.2 62.6 63.0 63.4 63.8 64.2 64.6 65.0 65.4 65.8 66.2 66.6
[31] 67.0 67.4 67.8 68.2 68.6 69.0 69.4 69.8 70.2 70.6 71.0 71.4 71.8 72.2 72.6
[46] 73.0 73.4 73.8 74.2 74.6 75.0

$y
 [1] 109.8042 110.4970 111.1898 111.8825 112.5753 113.2681 113.9608 114.6536
 [9] 115.3485 116.0971 117.0000 118.1214 119.3694 120.6168 121.8162 123.0000
[17] 124.1961 125.3995 126.5980 127.7930 129.0000 130.2237 131.4243 132.5557
[25] 133.6865 135.0000 136.6001 138.2531 139.6541 140.8021 142.0000 143.4815
[33] 145.1507 146.8334 148.4468 150.0000 151.5249 153.1289 154.9329 156.9329
[41] 159.0000 161.0269 163.0134 164.9860 166.9580 168.9301 170.9021 172.8741
[49] 174.8461 176.8181 178.7902

attr(,"class")
[1] "xyVector"
>
>
>
>
>
> dev.off()
null device
          1
>
|
Created & Maintained by Osamu Ogasawara (osamu.ogasawara@gmail.com) and 