A list of plate data.
Each element provides data for a plate and is expected to be a
vector of length at least nx*ny (only the first nx*ny elements will be displayed).
The values are assumed to come in row-by-row order, e.g. A1, A2, A3,
..., B1, B2, ...
Alternatively, the elements of z can be factors that represent
well or spot classes (e.g. the different types of controls, empty
wells, wells with reagent of interest).
ncol
Integer of length 1. Number of columns (plates in one row) for the plot.
zrange
If the elements of z are numeric, then this
optional parameter can be used to specify the numeric range that is
mapped to the color scale; by default, a symmetric interval
around the median of unlist(z) is used.
If the elements of z are factors, then this optional
parameter can be used to specify the total ordered set of factor
levels; by default, the union of the levels of the elements of
z is used.
fill
If the elements of z are numeric, then this
parameter can be used to specify a character vector of color names
used to create a color ramp for the false color data
representation. The default
colors correspond to blue for low values, white for the middle of
the range and red for high values.
If the elements of z are factors, then this parameter can be
used to define the corresponding color names; by default, a
palette from RColorBrewer is used.
main
Character of length 1 or plotmath expression used for the plot title. To omit, set
this argument to length 0, to the empty character "", to FALSE
or to NULL.
do.names
Logical specifiying if plate captions should be plotted.
do.legend
Logical specifying if a legend for false color
values should be output.
legend.label
Character of length 1 or plotmath expression that is printed
next to the legend (see vignette for examples). To omit, set
this argument to length 0, to the empty character "", to FALSE
or to NULL.
nx
An integer for the number of columns in a plate. Default 24 for a 384-well plate.
ny
An integer for the number of rows in a plate. Default 16 for a 384-well plate.
na.fill
Color for NA values.
do.grid.newpage
Logical, if TRUE, then the function
grid.newpage is called at the begin of this function.
Value
None. The function is called for its side effect.
Author(s)
Wolfgang Huber, based on an earlier version by Oleg Sklyar.
R version 3.3.1 (2016-06-21) -- "Bug in Your Hair"
Copyright (C) 2016 The R Foundation for Statistical Computing
Platform: x86_64-pc-linux-gnu (64-bit)
R is free software and comes with ABSOLUTELY NO WARRANTY.
You are welcome to redistribute it under certain conditions.
Type 'license()' or 'licence()' for distribution details.
R is a collaborative project with many contributors.
Type 'contributors()' for more information and
'citation()' on how to cite R or R packages in publications.
Type 'demo()' for some demos, 'help()' for on-line help, or
'help.start()' for an HTML browser interface to help.
Type 'q()' to quit R.
> library(splots)
> png(filename="/home/ddbj/snapshot/RGM3/R_BC/result/splots/plotScreen.Rd_%03d_medium.png", width=480, height=480)
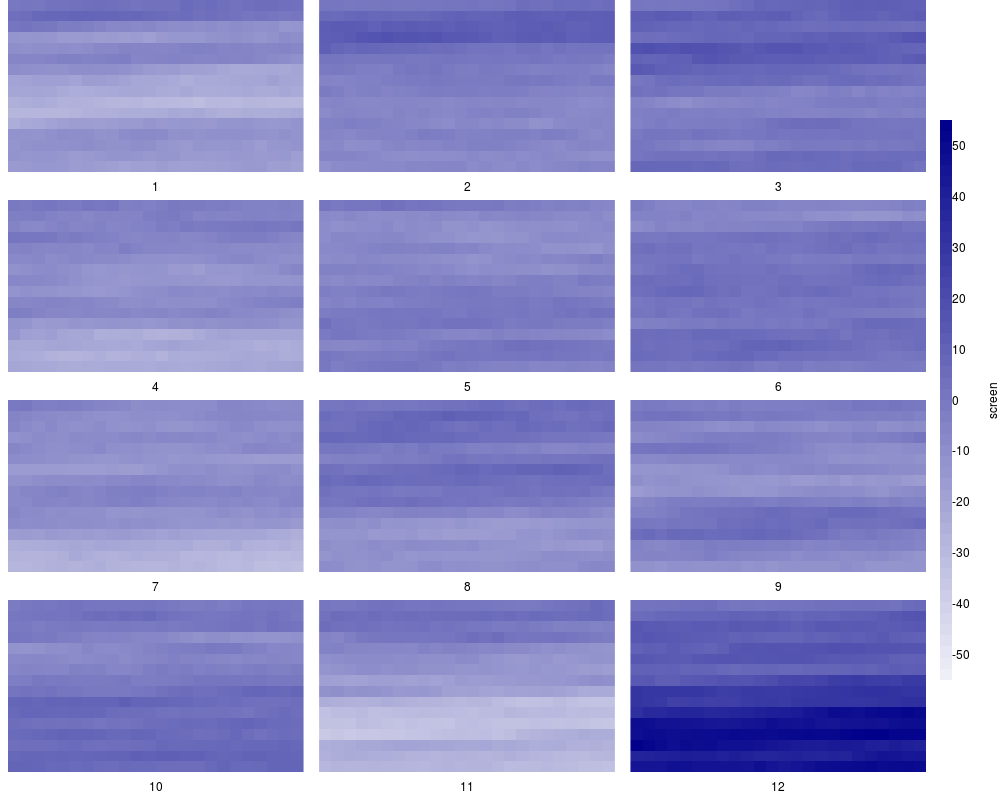
> ### Name: plotScreen
> ### Title: Plot a false-color representation of screening data
> ### Aliases: plotScreen
> ### Keywords: dplot array
>
> ### ** Examples
>
> screen = lapply(1:12, function(i) cumsum(rnorm(384)))
> plotScreen(screen, ncol=3, fill=c("white", "darkblue"))
>
>
>
>
>
> dev.off()
null device
1
>
 .
.