Supported by Dr. Osamu Ogasawara and  . . |
|
Last data update: 2014.03.03 |
Draw a Heat MapDescriptionA heat map is a false color image (basically
Usage
heatmap(x, Rowv = NULL, Colv = if(symm)"Rowv" else NULL,
        distfun = dist, hclustfun = hclust,
        reorderfun = function(d, w) reorder(d, w),
        add.expr, symm = FALSE, revC = identical(Colv, "Rowv"),
        scale = c("row", "column", "none"), na.rm = TRUE,
        margins = c(5, 5), ColSideColors, RowSideColors,
        cexRow = 0.2 + 1/log10(nr), cexCol = 0.2 + 1/log10(nc),
        labRow = NULL, labCol = NULL, main = NULL,
        xlab = NULL, ylab = NULL,
        keep.dendro = FALSE, verbose = getOption("verbose"), ...)
Arguments
DetailsIf either If either is a vector (of ‘weights’) then the appropriate
dendrogram is reordered according to the supplied values subject to
the constraints imposed by the dendrogram, by By default ( The default colors are not pretty. Consider using enhancements such as the RColorBrewer package. ValueInvisibly, a list with components
NoteUnless
Author(s)Andy Liaw, original; R. Gentleman, M. Maechler, W. Huber, revisions. See Also
Examples
require(graphics); require(grDevices)
x <- as.matrix(mtcars)
rc <- rainbow(nrow(x), start = 0, end = .3)
cc <- rainbow(ncol(x), start = 0, end = .3)
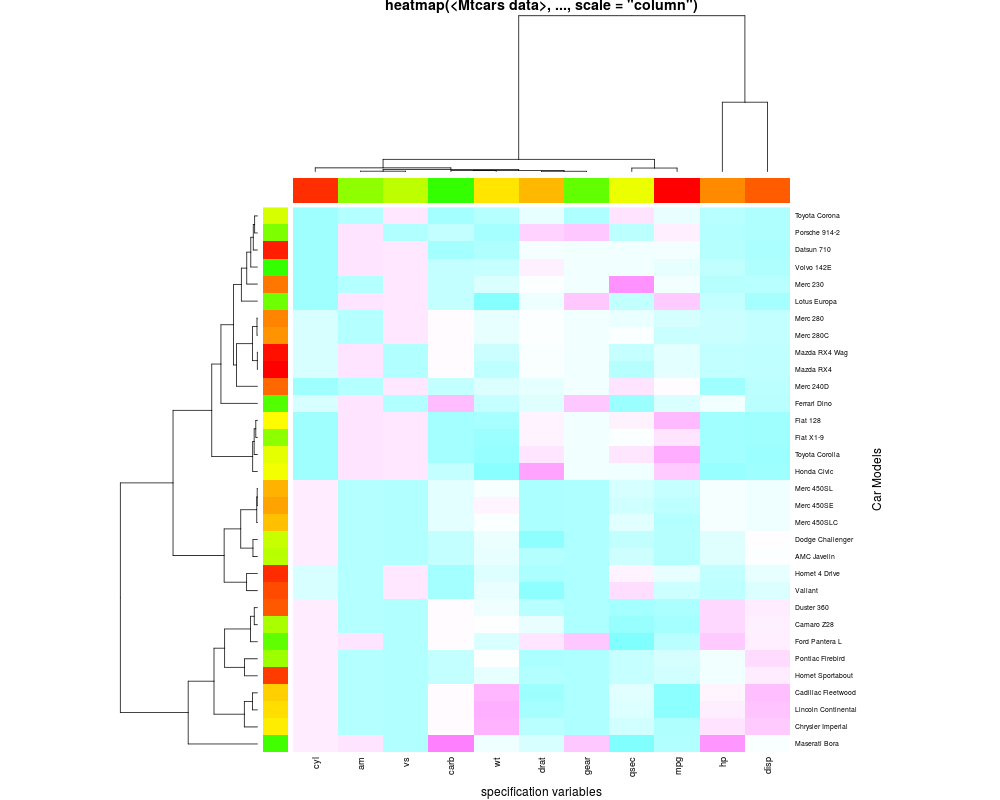
hv <- heatmap(x, col = cm.colors(256), scale = "column",
RowSideColors = rc, ColSideColors = cc, margins = c(5,10),
xlab = "specification variables", ylab = "Car Models",
main = "heatmap(<Mtcars data>, ..., scale = "column")")
utils::str(hv) # the two re-ordering index vectors
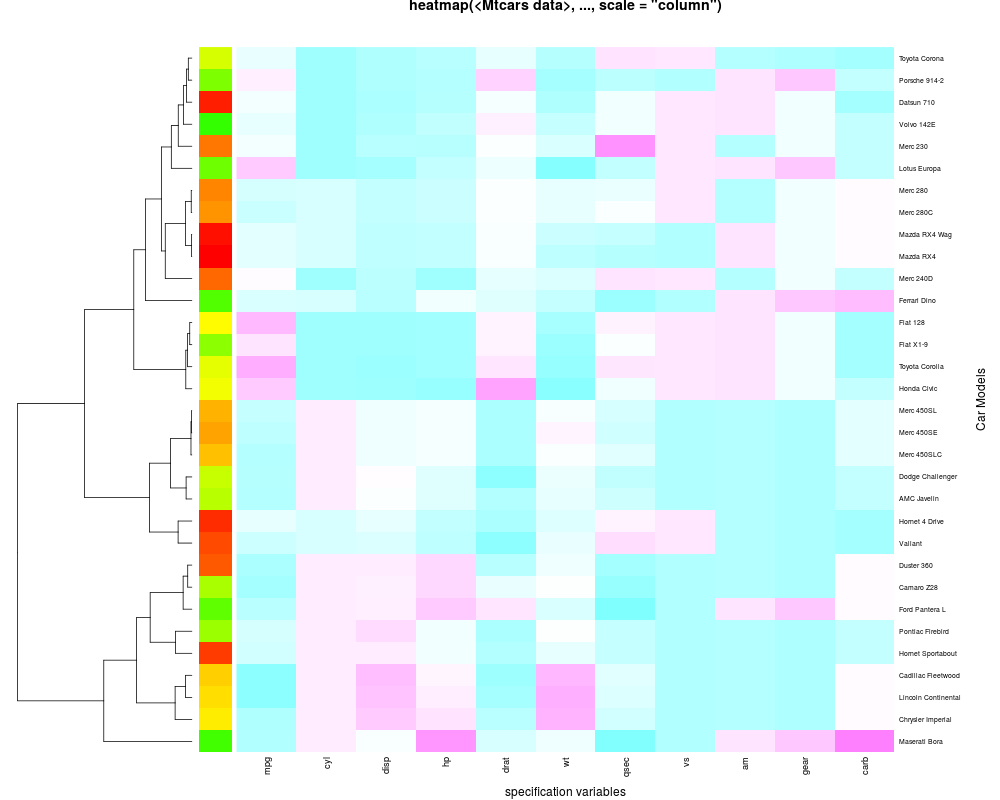
## no column dendrogram (nor reordering) at all:
heatmap(x, Colv = NA, col = cm.colors(256), scale = "column",
RowSideColors = rc, margins = c(5,10),
xlab = "specification variables", ylab = "Car Models",
main = "heatmap(<Mtcars data>, ..., scale = "column")")
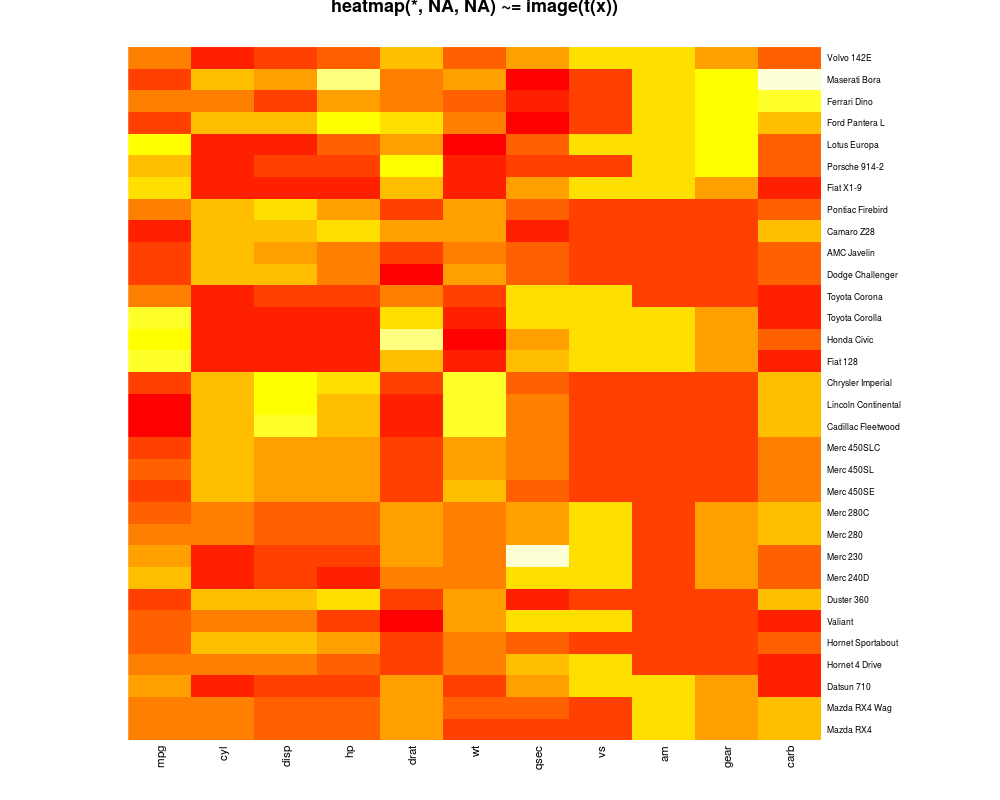
## "no nothing"
heatmap(x, Rowv = NA, Colv = NA, scale = "column",
main = "heatmap(*, NA, NA) ~= image(t(x))")
round(Ca <- cor(attitude), 2)
symnum(Ca) # simple graphic
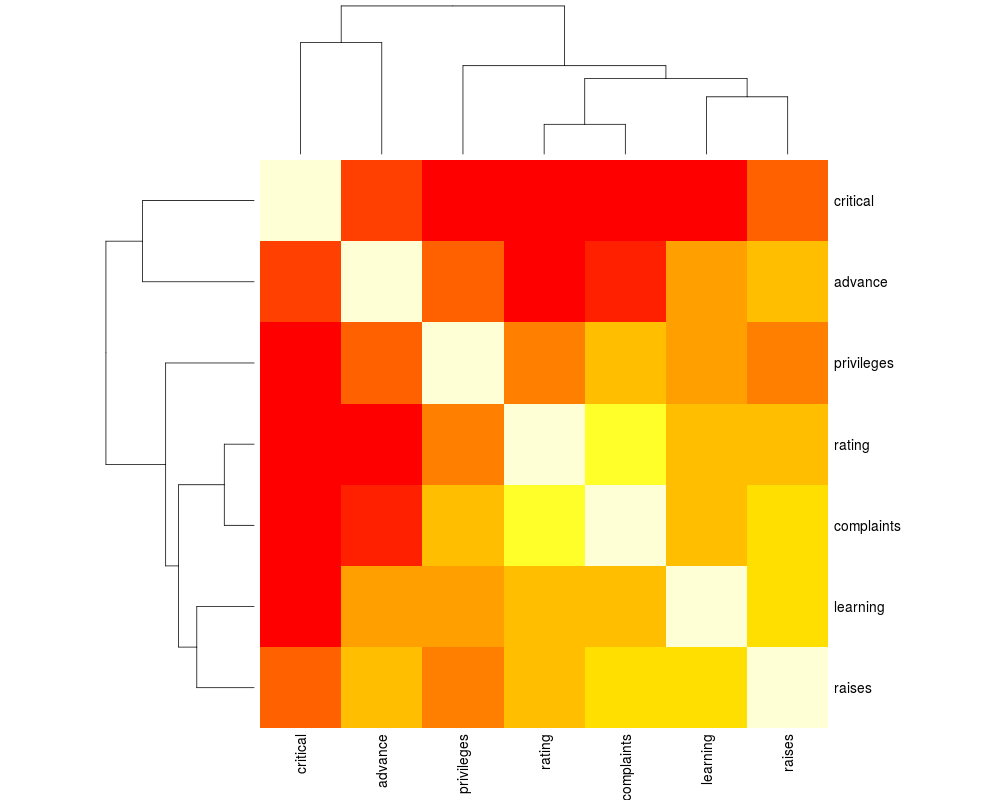
heatmap(Ca, symm = TRUE, margins = c(6,6)) # with reorder()
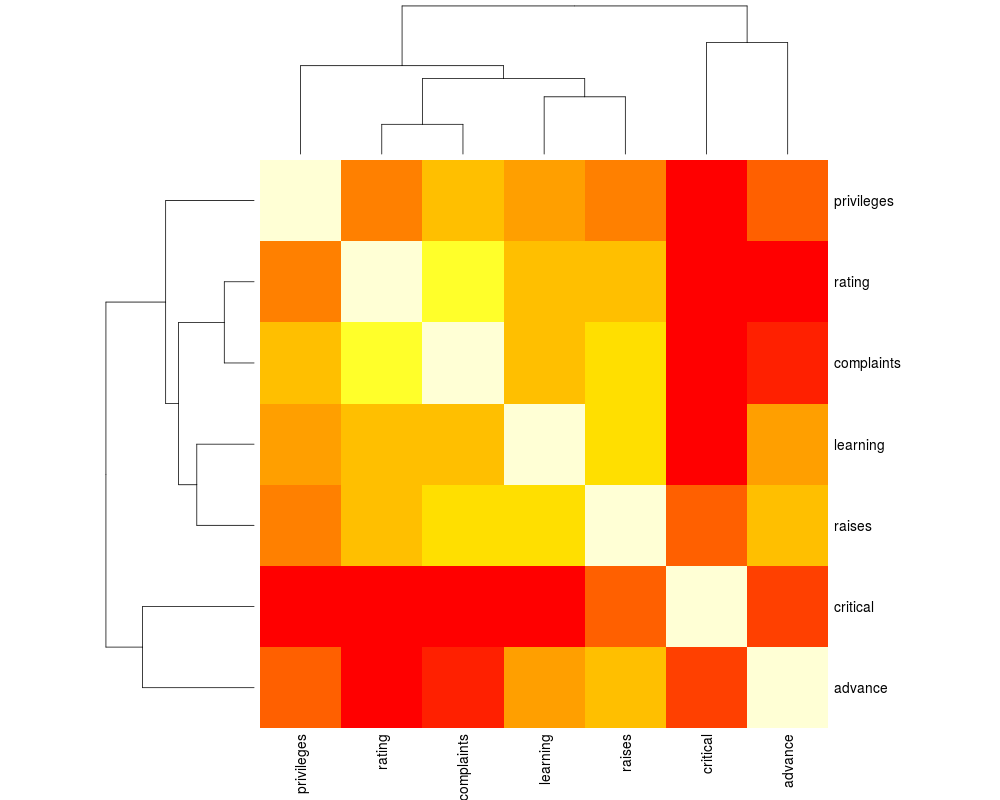
heatmap(Ca, Rowv = FALSE, symm = TRUE, margins = c(6,6)) # _NO_ reorder()
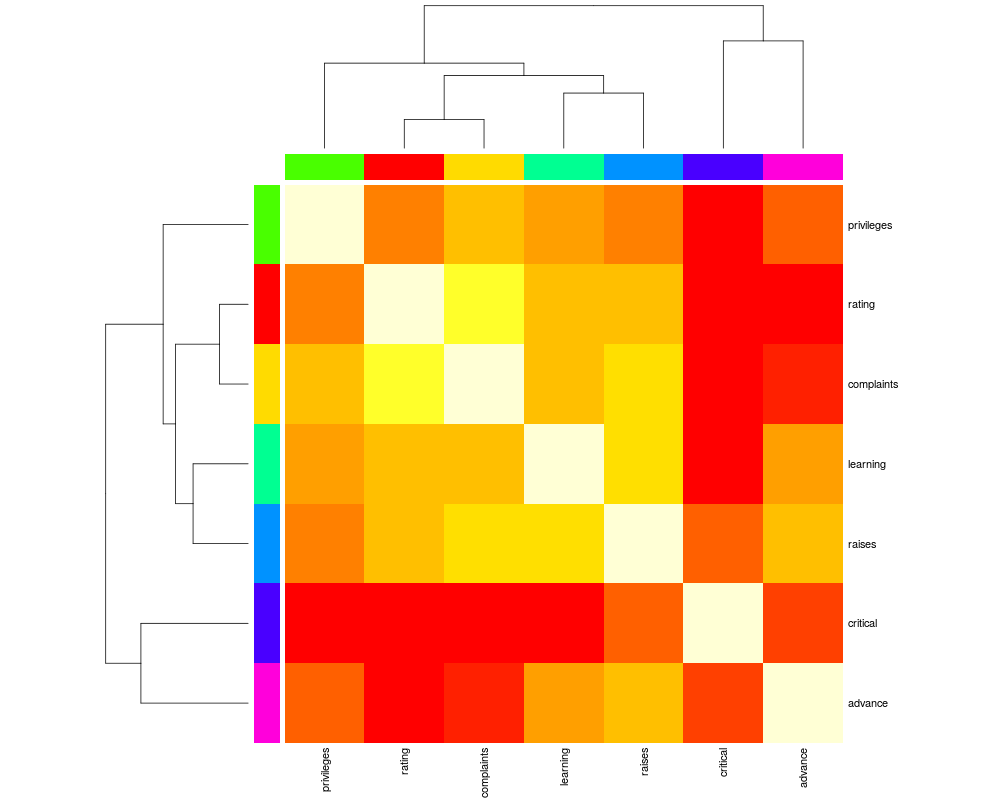
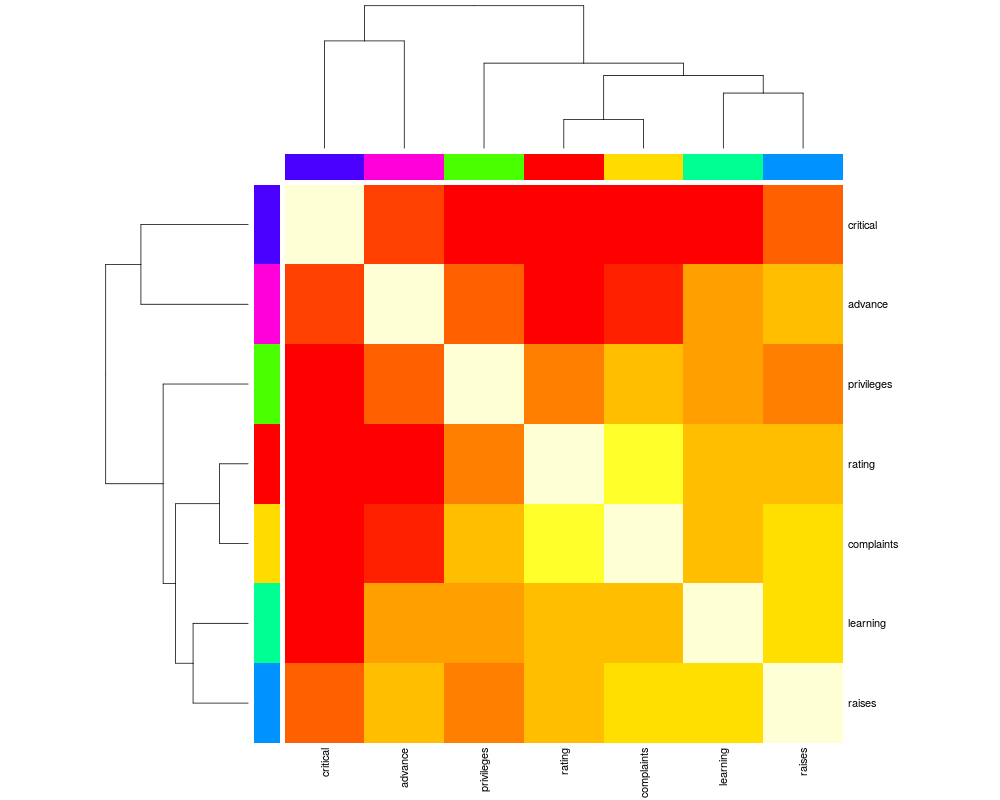
## slightly artificial with color bar, without and with ordering:
cc <- rainbow(nrow(Ca))
heatmap(Ca, Rowv = FALSE, symm = TRUE, RowSideColors = cc, ColSideColors = cc,
margins = c(6,6))
heatmap(Ca, symm = TRUE, RowSideColors = cc, ColSideColors = cc,
margins = c(6,6))
## For variable clustering, rather use distance based on cor():
symnum( cU <- cor(USJudgeRatings) )
hU <- heatmap(cU, Rowv = FALSE, symm = TRUE, col = topo.colors(16),
distfun = function(c) as.dist(1 - c), keep.dendro = TRUE)
## The Correlation matrix with same reordering:
round(100 * cU[hU[[1]], hU[[2]]])
## The column dendrogram:
utils::str(hU$Colv)
Results
R version 3.3.1 (2016-06-21) -- "Bug in Your Hair"
Copyright (C) 2016 The R Foundation for Statistical Computing
Platform: x86_64-pc-linux-gnu (64-bit)
R is free software and comes with ABSOLUTELY NO WARRANTY.
You are welcome to redistribute it under certain conditions.
Type 'license()' or 'licence()' for distribution details.
R is a collaborative project with many contributors.
Type 'contributors()' for more information and
'citation()' on how to cite R or R packages in publications.
Type 'demo()' for some demos, 'help()' for on-line help, or
'help.start()' for an HTML browser interface to help.
Type 'q()' to quit R.
> library(stats)
> png(filename="/home/ddbj/snapshot/RGM3/R_rel/result/stats/heatmap.Rd_%03d_medium.png", width=480, height=480)
> ### Name: heatmap
> ### Title: Draw a Heat Map
> ### Aliases: heatmap
> ### Keywords: hplot
>
> ### ** Examples
>
> require(graphics); require(grDevices)
> x <- as.matrix(mtcars)
> rc <- rainbow(nrow(x), start = 0, end = .3)
> cc <- rainbow(ncol(x), start = 0, end = .3)
> hv <- heatmap(x, col = cm.colors(256), scale = "column",
+ RowSideColors = rc, ColSideColors = cc, margins = c(5,10),
+ xlab = "specification variables", ylab = "Car Models",
+ main = "heatmap(<Mtcars data>, ..., scale = "column")")
> utils::str(hv) # the two re-ordering index vectors
List of 4
$ rowInd: int [1:32] 31 17 16 15 5 25 29 24 7 6 ...
$ colInd: int [1:11] 2 9 8 11 6 5 10 7 1 4 ...
$ Rowv : NULL
$ Colv : NULL
>
> ## no column dendrogram (nor reordering) at all:
> heatmap(x, Colv = NA, col = cm.colors(256), scale = "column",
+ RowSideColors = rc, margins = c(5,10),
+ xlab = "specification variables", ylab = "Car Models",
+ main = "heatmap(<Mtcars data>, ..., scale = "column")")
> ## Don't show:
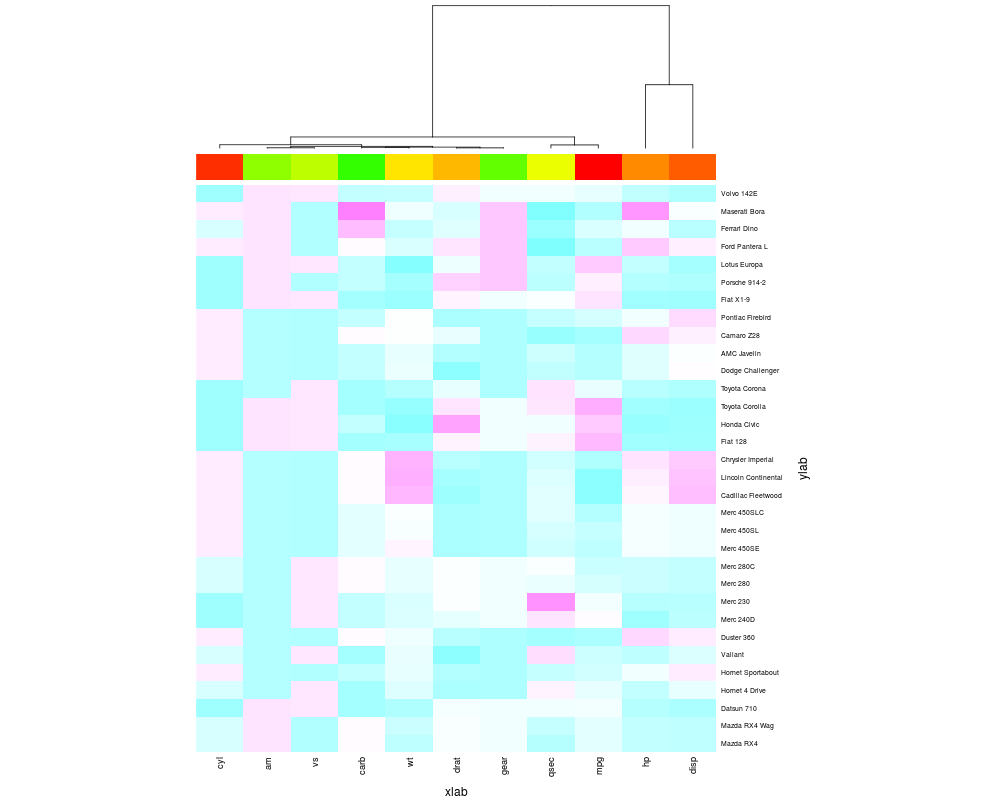
> ## no row dendrogram (nor reordering) at all:
> heatmap(x, Rowv = NA, col = cm.colors(256), scale = "column",
+ ColSideColors = cc, margins = c(5,10),
+ xlab = "xlab", ylab = "ylab") # no main
> ## End(Don't show)
> ## "no nothing"
> heatmap(x, Rowv = NA, Colv = NA, scale = "column",
+ main = "heatmap(*, NA, NA) ~= image(t(x))")
>
> round(Ca <- cor(attitude), 2)
rating complaints privileges learning raises critical advance
rating 1.00 0.83 0.43 0.62 0.59 0.16 0.16
complaints 0.83 1.00 0.56 0.60 0.67 0.19 0.22
privileges 0.43 0.56 1.00 0.49 0.45 0.15 0.34
learning 0.62 0.60 0.49 1.00 0.64 0.12 0.53
raises 0.59 0.67 0.45 0.64 1.00 0.38 0.57
critical 0.16 0.19 0.15 0.12 0.38 1.00 0.28
advance 0.16 0.22 0.34 0.53 0.57 0.28 1.00
> symnum(Ca) # simple graphic
rt cm p l rs cr a
rating 1
complaints + 1
privileges . . 1
learning , . . 1
raises . , . , 1
critical . 1
advance . . . 1
attr(,"legend")
[1] 0 ' ' 0.3 '.' 0.6 ',' 0.8 '+' 0.9 '*' 0.95 'B' 1
> heatmap(Ca, symm = TRUE, margins = c(6,6)) # with reorder()
> heatmap(Ca, Rowv = FALSE, symm = TRUE, margins = c(6,6)) # _NO_ reorder()
> ## slightly artificial with color bar, without and with ordering:
> cc <- rainbow(nrow(Ca))
> heatmap(Ca, Rowv = FALSE, symm = TRUE, RowSideColors = cc, ColSideColors = cc,
+ margins = c(6,6))
> heatmap(Ca, symm = TRUE, RowSideColors = cc, ColSideColors = cc,
+ margins = c(6,6))
>
> ## For variable clustering, rather use distance based on cor():
> symnum( cU <- cor(USJudgeRatings) )
CO I DM DI CF DE PR F O W PH R
CONT 1
INTG 1
DMNR B 1
DILG + + 1
CFMG + + B 1
DECI + + B B 1
PREP + + B B B 1
FAMI + + B * * B 1
ORAL * * B B * B B 1
WRIT * + B * * B B B 1
PHYS , , + + + + + + + 1
RTEN * * * * * B * B B * 1
attr(,"legend")
[1] 0 ' ' 0.3 '.' 0.6 ',' 0.8 '+' 0.9 '*' 0.95 'B' 1
>
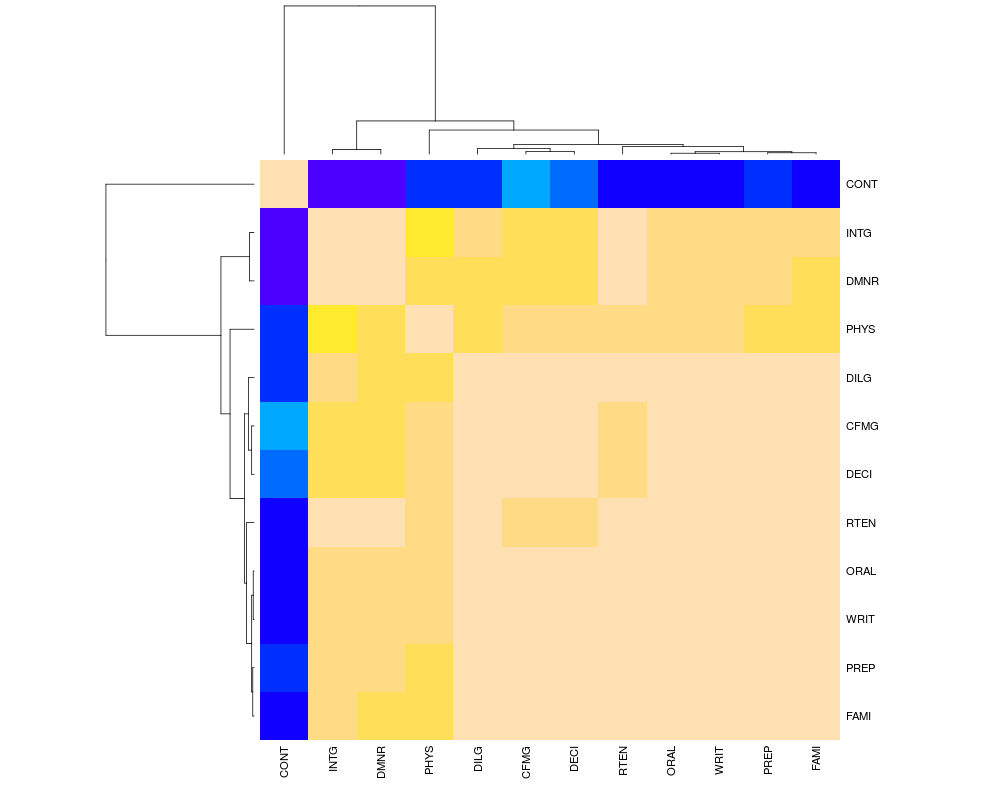
> hU <- heatmap(cU, Rowv = FALSE, symm = TRUE, col = topo.colors(16),
+ distfun = function(c) as.dist(1 - c), keep.dendro = TRUE)
> ## The Correlation matrix with same reordering:
> round(100 * cU[hU[[1]], hU[[2]]])
CONT INTG DMNR PHYS DILG CFMG DECI RTEN ORAL WRIT PREP FAMI
CONT 100 -13 -15 5 1 14 9 -3 -1 -4 1 -3
INTG -13 100 96 74 87 81 80 94 91 91 88 87
DMNR -15 96 100 79 84 81 80 94 91 89 86 84
PHYS 5 74 79 100 81 88 87 91 89 86 85 84
DILG 1 87 84 81 100 96 96 93 95 96 98 96
CFMG 14 81 81 88 96 100 98 93 95 94 96 94
DECI 9 80 80 87 96 98 100 92 95 95 96 94
RTEN -3 94 94 91 93 93 92 100 98 97 95 94
ORAL -1 91 91 89 95 95 95 98 100 99 98 98
WRIT -4 91 89 86 96 94 95 97 99 100 99 99
PREP 1 88 86 85 98 96 96 95 98 99 100 99
FAMI -3 87 84 84 96 94 94 94 98 99 99 100
> ## The column dendrogram:
> utils::str(hU$Colv)
--[dendrogram w/ 2 branches and 12 members at h = 1.15]
|--leaf "CONT"
`--[dendrogram w/ 2 branches and 11 members at h = 0.258]
|--[dendrogram w/ 2 branches and 2 members at h = 0.0354]
| |--leaf "INTG"
| `--leaf "DMNR"
`--[dendrogram w/ 2 branches and 9 members at h = 0.187]
|--leaf "PHYS"
`--[dendrogram w/ 2 branches and 8 members at h = 0.075]
|--[dendrogram w/ 2 branches and 3 members at h = 0.0438]
| |--leaf "DILG"
| `--[dendrogram w/ 2 branches and 2 members at h = 0.0189]
| |--leaf "CFMG"
| `--leaf "DECI"
`--[dendrogram w/ 2 branches and 5 members at h = 0.0584]
|--leaf "RTEN"
`--[dendrogram w/ 2 branches and 4 members at h = 0.0187]
|--[dendrogram w/ 2 branches and 2 members at h = 0.00657]
| |--leaf "ORAL"
| `--leaf "WRIT"
`--[dendrogram w/ 2 branches and 2 members at h = 0.0101]
|--leaf "PREP"
`--leaf "FAMI"
>
>
>
>
>
> dev.off()
null device
1
>
|